The Exact Timing of Near-Term Human Extinction Is Academic

Tags

, , , , , , , , , , , , , , ,

This post is in response to Systemic Disorder commenter Palloy who thinks that peak oil will save mankind and that global warming “will not be as bad as +1.5°C.” I want to answer the question of what degree of warming we are already committed to if industrial civilization were to disappear off the face of the Earth right now.

Palloy is overlooking the part that aerosols from industrial activity play in temporarily cooling the planet. James Hansen called this the Faustian Bargain:

…Human activity modifies the impact of the greenhouse effect by the release of airborne particulate pollutants known as aerosols. These include black-carbon soot, organic carbon, sulphates, nitrates, as well as dust from smoke, manufacturing, wind storms, and other sources. Aerosols have a net cooling effect because they reduce the amount of sunlight that reaches the ground and they increase cloud cover. This is popularly known as “global dimming”, because the overall aerosol impact is to mask some of the warming effect of greenhouse gases.

Hansen’s new study estimates this aerosol “dimming” at 1.2 degrees (plus or minus 0.2°), much higher than previously figured. Aerosols are washed out of the atmosphere by rain on average every 10 days, so their cooling effect is only maintained because of continuing human pollution, the principal source of which is the burning of fossil fuels, which also cause a rise in carbon dioxide levels and global warming that lasts for many centuries…

The average global temperature rise thus far is about 0.85°C since the onset of the Industrial Revolution. Once industrial activity ceases and its accompanying aerosols fall out of the atmosphere, the average global temperature will jump to about 2°C, but it won’t simply stop there because Palloy forgets that there is a lag time involved with CO2 emissions. The effects we are feeling now were from our emissions 40 years ago:

…The estimate of 40 years for climate lag, the time between the cause (increased greenhouse gas emissions) and the effect (increased temperatures), has profound negative consequences for humanity. However, if governments can find the will to act, there are positive consequences as well.

With 40 years between cause and effect, it means that average temperatures of the last decade are a result of what we were thoughtlessly putting into the air in the 1960’s. It also means that the true impact of our emissions over the last decade will not be felt until the 2040’s. This thought should send a chill down your spine!…

This “committed warming” of past CO2 emissions whose effect will be manifested in the coming decades is about 0.6 degrees Celsius. Adding up the current warming of 0.85°C from the onset of the Industrial Revolution, the loss of aerosols with global dimming at 1.2°C, and the “committed” temperature rise from the 40-year lag time of CO2 emissions equal to 0.6°C, we get a total of 2.65°C. If all industrial activity stopped right now, we would already be committed to 2.65°C, a global average temperature rise of three times what we are currently experiencing. With all the drought, flooding, hurricanes, landslides, fires, and other manifestations of climate change that we are undergoing now, I shudder to think what the world will be like in 2050 and yet humans continue to burn coal and other fossil fuels at breakneck speed. According to the Climate Accountability Institute, half of all emissions have been produced in the past 25 years.

Now we get to the even more insidious aspects of anthropogenic climate change that very few comprehend. Dozens of self-reinforcing feedback loops have already been triggered, but we’ll discuss only one, the albedo effect, in the loss of our planet’s air conditioners, the Arctic and Antarctic:

(1)   An increase in temperature decreases the area covered by sea ice as it melts leaving a larger area of exposed ocean.
(2)   This decreases the reflection of sunlight as ice is far more reflective than the newly exposed ocean.
(3)   Reduced reflection increases the area’s absorption of heat from the sun.
(4)   This increases the temperature of the area, amplifying the original increase in temperature mentioned in (1).

A recent study calculated that the loss of Arctic ice reflectivity from 1979 to 2011 added an amplifying feedback to human warming equivalent to 25% of the heat captured by CO2 emissions during that same time.

We know that we don’t live in a linear world and that climate change is a non-linear phenomenon. Recent studies on abrupt climate change in Earth’s history reveal that temperatures have changed rapidly by 5°C in just 13 years. With the grand experiment mankind has irrevocably and haphazardly embarked on, the de-thawing of vast stores of permafrost and clathrates measured in the gigatons has commenced, creating the possibility for a sudden catastrophic release of such gases at any time. Methane, for about the first 10 to 20 years of its initial release before it breaks down into CO2, is many fold more potent as a greenhouse gas than carbon dioxide. Humans are too busy calculating everything in terms of economic profit with regards to newly exposed resources and shorter shipping routes in the Arctic to take the time to fathom what damage they have done. Industrial civilization has permanently disrupted the stable period known as the Holocene within which mankind and civilization have been allowed to prosper.

Thus, we can see that the world is changing quickly into an environment that may well be outside the habitability for humans. The timing of human near-term extinction is likely academic.

Apneaman left this message here just a short time ago:

Journalist Dahr Jamail & Professor Peter Wadhams say the resulting release of methane will lead to massive climate disruption, and that we have reached a point of no return.

Update (12-3-2014):

CO2 Takes Just 10 Years to Reach Planet’s Peak Heat (Not 40 Years)

In a study that could have important ramifications on estimating the impacts, costs and benefits of reducing carbon dioxide emissions, new research shows that CO2 brings peak heat within a decade of being emitted, with the effects then lingering 100 years or more into the future…

…The research, published Wednesday in Environmental Research Letters, provides policymakers and economists with a new perspective on how fast human carbon emissions heat the planet. Back-of-the-envelope estimates for how long it takes for a given puff of CO2 to crank up the heat have generally been from 40-50 years. But the new study shows that the timeframe for CO2 emissions to reach their maximum warming potential is likely closer to 10 years….
http://www.climatecentral.org/news/co2-emissions-peak-heat-18394

Staying in the environmental frying pan only gets us hotter

Capitalism, no matter what label is put on it such as “green” capitalism or “inclusive” capitalism, still has the self-destructive characteristics of capitalism embedded within it. The very recent PR campaign orchestrated by the financial elite of the world under the socially responsible-sounding title of “inclusive capitalism” is no exception:

Yesterday’s Conference on Inclusive Capitalism co-hosted by the City of London Corporation and EL Rothschild investment firm, brought together the people who control a third of the world’s liquid assets – the most powerful financial and business elites – to discuss the need for a more socially responsible form of capitalism that benefits everyone, not just a wealthy minority.

Leading financiers referred to statistics on rising global inequalities and the role of banks and corporations in marginalising the majority while accelerating systemic financial risk – vindicating the need for change.

While the self-reflective recognition by global capitalism’s leaders that business-as-usual cannot continue is welcome, sadly the event represented less a meaningful shift of direction than a barely transparent effort to rehabilitate a parasitical economic system on the brink of facing a global uprising.

Central to the proceedings was an undercurrent of elite fear that the increasing disenfranchisement of the vast majority of the planetary population under decades of capitalist business-as-usual could well be its own undoing….

Systemic Disorder has written a clear-minded essay explaining why nothing short of a complete paradigm shift away from capitalism’s inherent growth and profit-maximizing imperatives is needed to save mankind.

Systemic Disorder's avatarSystemic Disorder

Green capitalism is destined to fail: You can’t keep doing the same thing and expect different results. We can’t shop our way out of global warming nor are there technological magic wands that will save us. There is no alternative to a dramatic change in the organization of the global economy and consumption patterns.

Such a change will not come without costs — but the costs of doing nothing, of allowing global warming to precede is far greater. Therefore it is healthy to approach with a dose of skepticism the Intergovernmental Panel on Climate Change (IPCC) report that concludes the annual reduction in “consumption growth” on a global basis would be only 0.06 percent during the course of the 21st century. Almost nothing!

Wahiba Sands, Oman (Photo by Andries Oudshoorn) Wahiba Sands, Oman (Photo by Andries Oudshoorn)

The “Summary for Policymakers” supplement of the IPCC’s Climate Change 2014: Mitigation of Climate Change report, a dense 33-page document…

View original post 2,364 more words

Endlessly Apologizing for a Self-Destructive System

Tags

, , , , , , , , , , , , , , , , , , , , ,

occupytoronto-021

Although I agree with much of what J. H. Kunstler has to say, particularly on his analysis of energy and his critiques of American suburbia, when it comes to his views on the human-made system that is driving this entire train wreck, he gets it dead wrong. Here is a quote from his last blog post:

Now I am, going to reveal to you why it is so difficult to get a live human being on the telephone at these important places: because the more of a racketeering matrix medicine becomes, the more it seeks to evade responsibility for the consequences. That is, the more medicine becomes a criminal enterprise, the less it wants to hear from its client/victims. The same ethos is at work in just about every other realm of corporate enterprise in the USA. Our problem in the USA is not “capitalism,” it’s racketeering. Why we fail to comprehend it is one of the abiding mysteries of contemporary life.

It ought to be self-evident that this could only happen in a profoundly corrupt, dishonest, and degenerate society, because it took the form of a social compact that accepted this sort of behavior as okay…

Kunstler is perpetuating a deep-seated myth about capitalism that many in American society repeat. Laying the blame on those victimized by an economic system, which by design exploits, disenfranchises, and discards its subjects, overlooks the fact that the problem is the system itself. Capitalism is not an ethical system, and its overriding force of motivation is always the bottom line. Inequality, conflict, and regulatory corruption are all part and parcel of capitalism. History has borne this out numerous times. Unless someone steps in to break them up, monopolies are the natural result of unbridled capitalism (Mindful Economics, Joel Magnuson):

Winner-take-all

Corporate money greases the wheels of the political system which then passes regulations discouraging competition and favoring large corporations. Regulatory capture is inevitably what happens when successful capitalists amass wealth and buy off the political class whose lifeblood is, after all, money. Under the present system, we will never see a candidate elected to office without a substantial war chest of funds stuffed with corporate ‘donations‘. Government does the bidding of capitalists, not vise versa. We saw this in spades with the election of Obama when all his campaign promises of “hope and change” evaporated into thin air as he filled his cabinet with Wall Street and Goldman Sachs cronies. Who wrote the legislation for Obama’s healthcare reform? — lobbyists for the healthcare industrial complex where, not surprisingly, “the big bucks are currently earned not through the delivery of care, but from overseeing the business of medicine.” The corruption that Kunstler decries is not an aberration of capitalism, but a natural feature of it:

…What chiefly drives this sort of political corruption today is capitalism’s structure. For many capitalist enterprises, competitive and other pressures exist to increase profits, growth rates, and/or market share. Their boards and top managers seek to find cheaper produced inputs and cheaper labor power, to extract more output from their workers, to sell their outputs at the highest possible prices and to find more profitable technologies. The structure provides them with every incentive of financial gain and/or career security and advancement to behave in those ways. Thus, boards and top managers seek the maximum obtainable assistance of government officials in all these areas and also try to pay the least possible portion of their net revenues as taxes. Boards of directors tap their corporations’ profits to corrupt mostly the top echelons of the government bureaucracy, those needed to make advantageous official decisions.

Individual capitalists act to corrupt government officials to serve their enterprise’s needs. Grouped into associations, they do likewise for their industries. When organized as a whole (in “chambers of commerce” or “manufacturers alliances,” etc.), they corrupt to secure their class interests. When such corruption is not secret, capitalists articulate their demands to corrupted officials as “good for the economy or society as a whole.” Such phrases constitute the “appropriate language” that enables officials publicly to disguise and hopefully to legitimate their corrupt acts.

Strict moral codes, regulations and laws have been imposed to prevent individual or grouped capitalists from corrupting government officials. Evidence suggests, however, that neither civic-minded ethics, nor regulations nor laws have come close to ending capitalists’ corruption. Countless government courts, commissions, etc., have hardly ended official complicities in that corruption. Mainstream economics mostly proceeds in its analyses and policy prescriptions as if rampant corruption did not exist. Mass media tend to treat capitalist corruption (at least in their home countries) as exceptional and government efforts to stop it as serious. These, too, are further examples of that “appropriate language” with which modern capitalist societies mask systemic corruption.
~ Richard D Wolff

Noam Chomsky uses the acronym RECD (Really Existing Capitalist Democracy, pronounced ‘wrecked‘) to describe the capitalism that exists in the real world, and he doesn’t hold out much hope for civilization surviving it. Any sort of idyllic form of capitalism only exists in people’s heads and is kept alive by the myth of laissez-faire capitalism (Mindful Economics, Joel Magnuson):

Myth of a free market

BeFunky_null_12.jpg

A democracy cannot exist without an informed and intelligent electorate, and when corporations and monied interests intentionally spin the news, the populous are reduced to conspiracy mongers and what Gore Vidal scoffingly called ‘consumer-depositors’ in thrall to the financial elite. Alas, the institution intended to educate the public, aka the Fourth Estate, on matters of vital importance has been thoroughly dismantled and perverted by capitalism. The internet, the last bastion of independent and alternative news, is soon to follow suite (Mindful Economics, Joel Magnuson):

media

If the masses are unable to see through the spin and distortion propagated by a class of greedy parasites, there is one entity that will not suffer the fate of the dispossessed, dying quietly in some dark corner. The Earth is not so forgiving to such continued capitalist assaults, and it’s not fooled by propaganda such as ‘sustainable development’, ‘green growth’, or ‘corporate social responsibility’. Since pre-industrial times, the global temperature has ‘only’ risen 0.85 degrees Celsius (1.5 degrees Fahrenheit), and we can already see the havoc to civilization’s infrastructure that climate chaos is wreaking. With forecasts of average global temperature to be many fold greater by mid century, it would seem that only a miracle will save us.

Systemic Disorder published an important essay yesterday on the systematic destruction of labor rights throughout the world. How long will these myths about capitalism persist until the exploited finally wake up and realize their blood, sweat, and sacrifice are what fills the coffers of the über rich? Many at the bottom of the economic hierarchy bend over backwards to apologize for our current system, calling it everything but capitalism. No matter how often capitalism fails, no matter how many people it kills, it is religiously touted as the only and the best economic system available despite its flaws. Will humans continue to amuse themselves to death, defending a systemically self-destructive system?

We watched the tragedy unfold
We did as we were told
We bought and sold
It was the greatest show on earth
But then it was over
We ohhed and aahed
We drove our racing cars
We ate our last few jars of caviar
And somewhere out there in the stars
A keen-eyed look-out
Spied a flickering light
Our last hurrah

And when they found our shadows
Grouped ’round the TV sets
They ran down every lead
They repeated every test
They checked out all the data on their lists
And then the alien anthropologists
Admitted they were still perplexed
But on eliminating every other reason
For our sad demise
They logged the only explanation left
This species has amused itself to death . . .

Business-As-Usual on a Dying Planet

Tags

, , , , , , , , , , , , , , , , , , , , , ,

Molotov

A recent investigative piece by Vice on the aftermath of the BP oil spill, America’s most devastating environmental accident to date and the “largest accidental marine oil spill in the history of the petroleum industry”, shows that people are still getting sick and dying in the Gulf region.

Award winning chemist, Dr. Wilma Subra, conducted blood tests on Gulf Coast residents who were symptomatic with new illnesses and found that some of the cancer-causing agents were 65 times the expected level in the victims blood tests. Subra noted that Corexit is in the air, the water and the Gulf resident’s blood.

“There’s a whole population that’s very sick and doesn’t have access to medical care, and that’s what we’ve been trying to work on now, from the very beginning, is getting them medical care so they will get better,” says Subra. “How many people do you think we’re talking about, do we have any guess?” “Hundreds of thousands along the whole coastal area,” Subra says. “Hundreds of thousands of people?” “That are sick, yes.”

It also is likely that the BP cleanup workers are going to suffer the same fate. Listen to what Dr. Wilma Subra had to say about the health of this group.

These findings can leave little doubt that BP’s use of Corexit has seriously compromised the collective life span of Gulf Coast residents. This is a staggering implication for the collective longevity in the Gulf. – link

Nearly 2 millions gallons of Corexit were used to prevent the millions of barrels of leaked oil from hitting shorelines. Where did all that oil go? Once Corexit is dispersed over an oil slick, it causes the spilled oil to break apart and sink to the bottom of the ocean. In the case of the BP oil spill, this toxic material created massive kill zones on the Gulf floor. When oil and Corexit are mixed together, the resultant substance becomes 52 times more toxic and penetrates human skin much easier. The locals don’t eat what they catch, but remember that Obama said it was safe.

Corexit has been banned in 18 countries, including the UK, because “it is a cancerous causing neurotoxin pesticide that is acutely toxic to both human and marine life.” Every time there is a strong storm, the Corexit chemical and oil mixture gets swept up onto shore and enters the water cycle:

As of early October 2013, the United States Environmental Protection Agency (EPA) website specifically stated that the spill should have no effect on drinking water, and that any questions residents might have about their water should be directed to their drinking water provider. The website fails to mention that water from the Gulf, mixed with oil and Corexit could make its way into the ecosystem eventually, washing up onto the Gulf’s shores and seeping insidiously into the ground water. Florida’s ground water aqueduct system provides drinking water to 18 million residents. – link

The happy motoring culture of suburban sprawl, bread & circus infotainment, and celebrity/wealth worship has long since forgotten what has been called “the biggest public health crisis from a chemical poisoning in the history of this country“. Entrapped by poverty and lacking the means to escape the Gulf region,  its residence have become part of the sacrifice zone offered up in the name of profit to the carbon-hungry God of industrial civilization.

None of the locals who took part in the clean-up effort were told of the dangers to their health, nor were they allowed to wear protective gear such as respiratory masks, suits, and gloves because it would have more accurately conveyed to the world the true nature of the disaster. More recently, BP has been accused of hiring internet trolls to threaten critics of its handling of the 2010 disaster. Surely the authorities were aware of the aftermath from the Exxon Valdez accident wherein the same dispersant was used by those clean-up workers who are now nearly all dead at the average age of 51. For BP and the U.S. government, image and corporate interests override the horrific realities of ecocide and corporate manslaughter. Better to sink the oil out of sight and mind in order to maintain the illusion that all is well rather than have a company pay the full cost for its recklessness. All that oil mixed with Corexit is now a 3 to 4 inch toxic layer blanketing the bottom of the Gulf of Mexico, inhibiting its biodegradation by natural oil-consuming bacteria and prolonging the disaster for decades. And BP is once again allowed to bid for U.S. government contracts after having sued the EPA in 2013 to lift the suspension. Of course lots of conspiracy theories surrounded the BP oil spill, but the only real conspiracy here was the government/corporate collusion to hide and minimize the damage, control the public’s perception of the disaster, and protect corporate profits over people and environment — nothing out of the ordinary for the corporatocracy we live under, here or abroad.

It’s not just in the oceans that we have to worry about oil spills. If we look at just one set of data from one inland state, you can get an idea of the staggering scale of the fallout from the oil drenched machine of industrial civilization:

Snap 2014-05-19 at 08.56.37

When you take into account all the global destruction that capitalist industrial civilization has wrought over the last few centuries, you realize no solution will ever be forthcoming from our corporate overlords. The idea of corporate social responsibility (CSR) is simply a PR and marketing ploy. CSR employs ineffective market-based solutions, making it appear that a corporation is addressing a social or environmental problem when in fact it only serves to protect corporate financial interests and shift the blame to the individual and elsewhere. Over decades, corporations have molded society into atomized, uninformed, and passive consumers who parrot the same talking points fed to them from the mainstream media. Those wielding the power in society and leading mankind over a cliff are the same ones that hide behind the moniker of CSR, a smokescreen for continuing the looting and polluting of the planet to the point of ecological collapse.

521622_591434340867473_1869861116_n As the catastrophes of the BP oil spill and Fukushima illustrate, a bankrupt planet is preferable to them over a bankrupt corporation. The Tragedy of the commons, as Noam Chomsky points out, has been perverted and twisted by the widespread adoption of the capitalist ethos. It actually means the opposite of what most have been taught to believe:

…there is another part of Magna Carta which has been forgotten. It had two components. The one is the Charter of Liberties which is being dismantled. The other was called the Charter of the Forests. That called for protection of the commons from the depredations of authority. This is England of course. The commons were the traditional source of sustenance, of food and fuel and welfare as well. They were nurtured and sustained for centuries by traditional societies collectively. They have been steadily dismantled under the capitalist principle that everything has to be privately owned, which brought with it the perverse doctrine of – what is called the tragedy of the commons – a doctrine which holds that collective possessions will be despoiled so therefore everything has to be privately owned. The merest glance at the world shows that the opposite is true. It’s privatization that is destroying the commons. That’s why the indigenous populations of the world are in the lead in trying to save Magna Carta from final destruction by its inheritors…

tumblr_n4jfednib51qjb4vfo1_1280 09-52-16

I’m afraid we are light years away from the Charter of the Forests and any sort of bucolic utopias. As for the future, think moonscapes, tumbleweeds, and the creaking sheet metal of rusted-out cars. The hyper-reality of megacities, with their pulsating neon lights and traffic-filled streets, will fall into silence and decay. Coastal cities will be swallowed up in watery graves. The impotence of man’s technology will become painfully evident as the global-scale geochemical disruptions caused by man quickly unfold, ripping asunder any hold we once had on Earth.

…If modern industrial capitalism were a person, he or she would be on suicide watch. The system that has brought us quantum physics and reality television, modern medicine and the columns of Andrew Bolt is set on a course which, by all the best reckoning, points directly to its doing itself in. If capitalism goes on — everything goes. Climate, coastlines, most living species, food supplies, the great bulk of humanity. And certainly, the preconditions for advanced civilisation, perhaps forever…
~ Renfrey Clarke

Occam’s Razor Dispels Many Outlandish Conspiracy Theories

Tags

, , , , , , , , , , , , , , , ,

8403825949_d8f364c516_z

Occam’s razor, or Ockham’s razor, is a line of reasoning which uses succinctness and simplicity, employing the least assumptions to arrive at the most probable hypothesis that fits the available evidence. In other words, given two equally plausible explanations for a given phenomenon, the one making the fewest assumptions is more likely correct. Its foundation rests on two guiding principle to cut through falsehoods and pseudoscience reasoning:

  1. The Principle of Plurality – Plurality should not be posited without necessity
  2. The Principle of Parsimony – It is pointless to do with more what is done with less

In the search for truth, this tool of reasoning has been used throughout history by scientists and philosophers in the creation of models and theories, by detectives in solving crimes, and by objective researchers in debunking convoluted conspiracy theories. Occam’s razor is embodied by the probability theory which says that “all assumptions introduce possibilities for error and if an assumption does not improve the accuracy of a theory, its only effect is to increase the probability that the overall theory is wrong.” It is a heuristic method to guide scientists in the development of theoretical models. In the case of anthropogenic climate change, it can be applied to show how those who are skeptical about AGW are forced to weave a much more tangled web in order to explain things:

The serious, mainstream science view goes like this:

  1. The greenhouse effect is real. Without it, average surface temperatures would be -15C, not +15C
  2. CO2 is a greenhouse gas
  3. CO2 levels have increased by 41% since pre-industrial times
  4. A 100% increase will cause a 1.2C rise in earth surface temperatures
  5. This rise will in turn cause a 3C (+/- 1.5C) rise in surface temperature.
    Explanatory video on this point here
  6. Any rise above 2C must be avoided

Reasonably simple, given the vast complexity of our planet’s climatic system, and in fact the handful of serious climate scientists on the “sceptic” side agree with points 1-4.

Now here is the climate “sceptic’s” case:

  1. The earth is not warming
  2. If it is warming, it is due to the sun
  3. The warming is due to some kind of natural variation
  4. It’s going to get cooler soon
  5. CO2 is too tiny to make a difference
  6. CO2 will make a difference but there’s nothing we can do about it
  7. We can afford to wait another 10-50 years to see if it is going to get hot then do something about it then
  8. It is going to warm but only a bit
  9. CO2 is good for us
  10. Cloud cover will extend in a warmer planet and cool us down (No it will not)
  11. All models are always wrong
  12. Some models show that the climate will not warm much
  13. It is all a conspiracy by climatologists, Greens, the nuclear industry and the UN
  14. It cannot be happening because it would mean that fossil energy would become unprofitable
  15. It is cold outside today
  16. Heat cannot get into the ocean
  17. And so on
  18. And so forth

What the above shows is that there is an endless complexity to the arguments brought by the “sceptics”, many of them self-contradictory.

They are not trying to present a coherent picture of reality, which is the aim of science. They are merely producing a stream of counter statements. I have been impressed recently that when I try to discuss the one point where agreement exists with a delayer, they rapidly change the subject to find disagreement.

In fact, their case often boils down to a mirror image of the case for man-made global warming. If we say white, they just say black.

I predict therefore that soon “sceptic” blogs will be quoting William of Occam as evidence for the truth of their case.

Another cock-eyed conspiracy theory is chemtrails which astronomer Bob Berman deconstructs using the logic of Occam’s razor:

Some folks regard contrails suspiciously. Apparently, many don’t know what they are. Several websites call the lines chemtrails, and think that the US military is deliberately spraying a substance upon the population.

This is silly for a number of reasons. First, if you’ve ever watched crop dusting you know that chemicals must be released very close to the ground. Released on high, they’d dissipate with the wind and take forever to get down; the concentration on the folks below would be zero. Second, my commercial pilot friends (along with the controllers at the FAA) would all have to go along with the plot, since they’d see the process happening. I’m a pilot and airplane owner myself: It’s NOT happening. Third, what would be the purpose? Some say mind control. But are people acting differently lately? Others say it’s to sow disease. But why would anyone want to do this? Who would go along with it? Finally, some say “chemtrails” are a government project to combat global warming. Nice, but then why should such a laudable effort be kept secret? Other web-based “explanations” involve even wackier stuff like electromagnetic rays.

Logic never placates the truly paranoid, and discussions are rarely satisfying. Those who “believe” WANT to believe, and claim soil tests show that dangerous substances have been found beneath the planes. But again, nothing released from 40,000 feet would ever reach the ground except diluted to zero. And, more to the point, the videos of these supposed “chemtrails” shown on the scare web sites are actually a common type of contrail. The believers claim they’ve only started around 1998 – but I’ve observed those “spreading out” contrails for over 40 years. They’re not new. They’re contrails. No mystery, and nothing sinister here at all.

And yet another imaginative conspiracy, thoroughly debunked by the scientific community, surrounds the terrorist attack of 9/11 in which its die-hard followers believe that elements within the U.S. government planned and executed a controlled demolition of the TWC towers and WTC 7 in order to justify the invasion of Middle East countries and restrict domestic civil liberties. The first obvious question is why would a nefarious group within the government go through the logistical nightmare of crashing airliners into buildings in addition to rigging those buildings beforehand when a massive truck bomb, Timothy McVeigh-style, would have sufficed? Was that elaborate scheme really necessary in order to galvanize the political will to invade a foreign country for oil? And as Noam Chomsky points out in the video below, why implicate nationals from our major ally Saudi Arabia instead of people from the very country the neocons so desperately wanted to invade, Iraq? Perhaps the Bush administration just enjoyed the extra hurdle of fabricating WMD’s because planning and executing such a byzantine maze of deception involving so many people was the best way to keep it all secret and ensure the highest probability of success.

Another article of faith among conspiracy theorists is that the conspiracy would not have to have been very large. In Crossing the Rubicon, Michael Ruppert writes that there didn’t have to be any more than two dozen people with complete foreknowledge of the attacks to orchestrate 9/11, and that they would all be “bound to silence by Draconian secrecy oaths.” But those numbers begin to balloon out of control if all of the people and institutions accused of playing a part in the cover-up are counted. They would have to have included the CIA; the Justice Department; the FAA; NORAD; American and United Airlines; FEMA; Popular Mechanics and other media outlets; state and local law enforcement agencies in Pennsylvania, Virginia, and New York; the National Institute of Standards and Technology; and, finally and perhaps most prominently, the 9/11 Commission. – link

[youtube:www.youtube.com/watch?v=SRV_MsbAZv4]

As more and more people fall off the economic ladder and lose faith in government, their plight will become fertile ground for conspiracy theorists looking to manipulate the anger and desperation of the dispossessed. JFK conspiracists have been around for nearly half a century and I think it’s fair to say that 9/11 conspiracists will have an even longer lifespan, perhaps outliving industrial civilization itself. The maxim of never letting a good crisis go to waste certainly held true for abusive power structures all across the globe after 9/11, but such an atrocity was inevitable due to nearly a century of nurturing and exploiting radical Islamists to serve the interests of the British and American Empires:

…When the Soviet Union invaded Afghanistan in the 1980’s, the West, led by the United States, countered by implementing the “Islam” strategy. The recruiting of Islamic militants from around the world to fight in the “jihad” included the recruitment of Osama bin Laden by Saudi and Pakistani intelligence services. [26]

Ultimately, British strategy manifested or transmogrified into American support for the ‘holy warriors’ against the Soviet invasion. The United States invested massive amounts of armoury, military training and billions of dollars in this enterprise.

Chalmers Johnson defined, ‘blowback’ “as a way of thinking of an individual, a class, a nation or an empire…” when employed in the arena of “international conflicts” this way of thinking, “has a tendency to blow back onto the party releasing it.” [27] The criminal events in New York and Washington almost ten years ago, were partly and clearly a blowback from the “Islam” strategy.

Whereas Britain concocted and propelled the “Islam” option into strategic consideration amongst policy makers during the Cold War period, it was then the United States which was largely seen to “release”, implement and support this policy in Afghanistan in the 1980’s.

In conclusion, it needs to be emphasised that as the provenance of this “Islam” strategy pre-dates the Cold War and even the emergence of the United States as a superpower, there is every reason to believe that it will also outlive a perceived declining United States. We can now see this in Libya where NATO has worked in conjunction with Libyan Islamists to overthrow the Gadhaffi regime. [28]

The inside job of 9/11 was not some fiendishly clever plot by Cheney and a crack team of explosive experts and false flag operatives. It was the net result of decades and decades of colonial rule and the thirst for resources by Western citizens weened on suburban living, gas-guzzling automobiles, fast food, and industrial age values. Much energy and time is wasted on chasing phantom villains, while the real problems pile up around our make-believe world. Looking into history as well as into the mirror might be more productive than a crusade to bring imaginative boogeymen to justice.

tumblr_n3vnfes2R71qbmgeto5_1280

Concocting Conspiracies as the World Burns

Tags

, , , , , , , , , ,

Conspiracy-Theories26

“A society enamoured with conspiracy theory is sliding into barbarity.”
~ David Livingstone Smith

Since Kevin Moore has twice mentioned a supposed “cognitive dissonance” with myself concerning Mike Ruppert over at NBL, I feel I must clarify things and correct him.

If you actually read the post I wrote about Mike Ruppert, then you would know that I was hardly “celebrating” Mike Ruppert’s life and work. Let me quote a line:

“In their search for the truth, perhaps some travel too far down the rabbit hole of civilizational and environmental collapse to ever escape its malignant shadow; it consumes them like a cancer.”

Ruppert was eaten up by his own obsession of finding meaning and truth in a chaotic world. My own thoughts on 9/11 go no further than it being blowback from American foreign policy and bureaucratic incompetence. I have no desire to waste time on wild and improbable conspiracy theories which have already been easily disproved numerous times. Do governments conspire to do underhanded things? Of course they do, but not all events are a government plot nor the handiwork of TPTB. It’s human nature to try to make sense of traumatic events and look for connections and patterns, very often where none exist, in order to manage collective anxiety in the face of uncertainty:

…Hyper-intellectualism is a driver of extreme political movements, too, whose leaders keep their followers riled up by serving them a steady diet of paranoia-inducing conspiracy theories. By “conspiracy theories” I don’t mean the belief that terrible conspiracies exist (they obviously do), but the fiction that attributes all the world’s ills to the secret machinations of an identifiable foe: the Jews, the Templars, the Jesuits, the “bankers,” the blacks, patriarchy, whomever. Anders Behring Breivik, the Norwegian mass murderer, wrote a 1,500-page manifesto that purported to expose the “alien system of beliefs, attitudes and values….that we have come to know as ‘Political Correctness.’” Its proponents, he said, included Islamists, Feminists, Frankfurt School Marxists, and multiculturalists of every stripe, all working together to bring about the collapse of the West…

…A study by scientists at Harvard University and the University of Helsinki, published in the Proceedings of the Royal Society, put his theory to the test and concluded that “behaviours which are, or appear, superstitious are an inevitable feature of adaptive behaviour in all organisms, including ourselves.”

All of us, in other words, are primed to believe evidence that supports our prejudices and predispositions, even when they’re wrong and the evidence for them is dubious or contrived…

The propensity of people to simultaneously believe multiple convoluted and oftentimes contradictory conspiracy theories despite repeated falsification has been empirically explained by University of Kent psychologists Michael J. Wood, Karen M. Douglas and Robbie M. Sutton in a paper entitled “Dead and Alive: Beliefs in Contradictory Conspiracy Theories,” published in the journal Social Psychological and Personality Science. 

Perhaps the most notorious conspiracy theorists are David Icke and Alex Jones, both of whom have built lucrative businesses peddling their views of the world:

icke_time_events

Snap 2014-05-04 at 08.27.28
Unfounded conspiracy theories have led to wars and mass death in the past and it’s my belief that we have to use reason over prejudice and suspicion in order to avoid such tragic outcomes. For example:

Snap 2014-05-04 at 09.15.25 Giving credence to alternative realities, whether it be by techno-utopians who think our technology will save us or business-as-usual proponents who claim that global warming is more beneficial than harmful, is not the aim of this website and I’ve only dabbled in such visions as an allegorical device in some posts. The realities of industrial civilization’s environmental meltdown are frightening enough without diverting our attention and degrading our credibility with outlandish and comical conspiracy theories of a faked lunar landing and controlled demolition of the WTC skyscrapers. Consider that our CO2 emissions will be in the atmosphere for thousands of years. That’s what makes AGW so catastrophic — their effect is essentially forever on a human and civilizational time scale. And climate change’s evil twin of ocean acidification will last for tens of thousands of years. When the cold hard facts are killing us systematically, why deal in fantasy?

[youtube:www.youtube.com/watch?v=MAcFXAtG0cQ]
[youtube:www.youtube.com/watch?v=hJmRbSX8Rqo]

The Dull Static

Tags

, , , , , , , , , , , ,

Originally posted at: Prayforcalamity.com


The flowering dogwoods are in bloom. Along the country lanes, the pink petals have already exploded into ephemeral radiance and begun to wither and fall from the branches of the Jane Magnolia trees. For me this means no longer having the agonizing luxury of hours to sit and write. After six months of bi-weekly essays, I feel I have expressed much of what had become balled up and cluttered in my mind, and now it is time to ruminate in the garden once again.

I named this blog, “Pray for Calamity,” because there are several major crises converging which threaten human civilization, and there are no existing structures capable of mitigating them. Democracy, capitalism, neo-liberal globalization; they are all incapable of undertaking the work necessary to avert cataclysm. The paradigms of thought and approach which are almost hardwired into the modern mind at this point, need to be scrubbed. Of the remaining, solvable ecological crises, which may not include climate change, there is no tool available to attend to them that comes from the conventional tool box of legal, lawful pursuit. These ecological crises, which range from topsoil depletion to tree extinctions to massive die off of oceanic life, cannot be remedied without a fundamental shift in the thinking of the people in the civilized world. If people do not begin to perceive the world as a living entity, interconnected, conscious, and with intrinsic value beyond how it can be carved up and sold, then it is only a matter of time until the human race begins to suffer on a massive scale due to their callous disregard for the other beings with whom they share this planet.

And then there are the political and economic and resource depletion crises as well.

Changing our minds, changing how we think, is physically speaking one of the easiest things we can do. However, when our egos and our identities are wholly interwoven with an idea or an ideology, changing our way of thinking and discarding the old ideas, can be the hardest thing we are asked to undertake. If our physical reality changes, this can create a rip in the threads that stitch our view of ourselves with a dogma or a paradigm. So I await calamity because the egos of the civilized have hardened their hearts and deafened their ears, and until those in the first world middle class feel the gnawing pain of persistent hunger and the fear of deafening uncertainty, they will refuse to consider that maybe everything they have been taught to believe about themselves and their collective destiny, is abjectly wrong.

We’re many generations overdue for a revolution, in our thinking. I’m not talking about blood and violence although I’m afraid thats already happened. I’m talking about a revolution that’s probably the hardest kind, the kind that takes place within the human soul and the human mind. To be able to tear everything down, throw everything out, and start with a completely fresh piece of paper and say, ‘OK, how do we solve this problem?’

Mike Ruppert said that in the documentary “Collapse.” While by no means a perfect man, Mike was a good person, and did his best to tell the truth as he knew it. He shot himself two weeks ago. He left many insights like this one as gifts for us.

People who become aware of the depth of the problems facing humanity at this juncture in time, often seek answers. They want to know what we need to do. Some suggest we need a revolution. Some suggest we need to take to the hills and hide on personal homesteads, to perhaps form communities of these homesteads and just hold on white knuckled through the bottle neck of collapse. Then there is Paul Kingsnorth of the Dark Mountain Project, who speaks of the difference between problems which are to be solved, and predicaments which are to be endured.

What do you do,” he asked, “when you accept that all of these changes are coming, things that you value are going to be lost, things that make you unhappy are going to happen, things that you wanted to achieve you can’t achieve, but you still have to live with it, and there’s still beauty, and there’s still meaning, and there are still things you can do to make the world less bad? And that’s not a series of questions that have any answers other than people’s personal answers to them. Selfishly it’s just a process I’m going through.” He laughed. “It’s extremely narcissistic of me. Rather than just having a personal crisis, I’ve said: ‘Hey! Come share my crisis with me!

Kingsnorth was recently interviewed by the New York Times. As a long time environmental activist who years ago lost faith that there is much we can do to “save the planet,” he decries the false hope sold by mainstream environmentalist groups. With friend Dougald Hine, Kingsnorth wrote the “Uncivilization” manifesto, on which The New York Times writes:

Uncivilization” was firm in its conviction that climate change and other ecological crises are predicaments, and it called for a cadre of like-minded writers to “challenge the stories which underpin our civilization: the myth of progress, the myth of human centrality and the myth of separation from ‘nature.’

On this matter I think Kingsnorth and Hine are right on the mark. We will never weather the predicaments before us, let alone solve what problems remain solvable, if we refuse to take an honest look at who we are, where we are, and just what the hell we are doing. I think this is a meditation that would benefit revolutionaries and those hiding in the hills alike. We must ask if civilization is something we are even interested in continuing. We must ask what it is we value most and whether or not the lifestyles we are cordoned into are even in line with those values. We must ask what it means to be human. And if we are to trust any of our conclusions, we must first find a way to step outside of everything our culture has programmed us to believe.

Civilization is a power structure. It is a rejection of natural law in favor of the control of those high on social hierarchies. Civilization is the domestication of nature and people alike. It is the creation of a once regional, now global farm where the multitudes of humans are livestock, restricted by the borders of various owners, and subjugated and exploited for the extraction of the surplus values generated by their labor. Non human life forms and entire ecosystems are subjugated likewise, and as this control apparatus is now world wide and hell bent on growing in scale year over year, life itself is at risk. Simultaneously, this architecture of domestication and control has blunted the souls of the humans it dominates, and like house pets, the great many people have been declawed and broken. This is the existential portion of the crisis we face. The meaninglessness of life on the inside. The dull static of the best case scenario, where those in the first world yearn for the life of tepid, safe predictability offered by the owner class, should only one produce enough without question or complaint. We are a wretched bunch who fetishize our oppressors and spew vitriol at insurrectionaries who would in trying to shake us loose even for a moment, dare make us late for work.

Navigating circumstances beyond our control in which masters are hostile to us, constantly maneuvering to exert more control over our lives as well as to extract more value from us even in our imprisonment or death; most people are surviving, not thriving. Merely jockeying through a preset condition of work and fee schedules has muted the potential of our species. What has been throttled cannot be measured in discoveries or inventions, but in the satisfaction of individuals and communities to thrive on their own terms. To be fully actualized and autonomous creatures. To witness the assembly line life of modern man is to suffer a snuff film.

If we are to rescue our own hearts and our minds, if we are to save the last embers of burning wildness in our souls and to break the tethers that bind our thinking to suicidal paradigms, then we must uncivilize. Like Buck in “The Call of the Wild,” we must seek to undomesticate ourselves, no only to survive the realities of the world into which we are being thrust, but because to be a house mutt lying bored at master’s feet is to barely exist at all.

So what does any of this really mean? What are the steps, the actions to undertake which will align the force of our arms with the rhythms of our hearts? Do we fight or do we flee? Or do we stand upon the hill and bear witness until the fire consumes us? Or is there perhaps some combination of all; a time for rebellion, a time to tend our gardens, and a time to merely sit and say goodbye?

Certainly, if people seek a recipe for action that can maintain society in a form even remotely similar to its present incarnation, then I offer nothing. If what people desire is a map of the future from which plans can be derived and survival assured, I have none. I think maybe it is time to give up on maps. Maybe it is time to just be in the territory for a while. Maybe it is time to give up on human words and to leave the electronic buzz of the internet and to set foot on soil and rock. If domestication is the product of being in the domicile, in the house, then perhaps what we need is to step outside. If the stories we have been told for generations have poisoned us; if these myths about the greatness of the lines on maps and the men who ruled those patchwork lines have only served to make us slaves to abstractions, engendering in us a self righteousness and a malice towards all that isn’t of our hands and seeding in us a fear of what lies outside comfortable walls, then perhaps it is time to go and to hear some different voices. To hear some new stories. Maybe, lost in the ballad of crowing frogs and moaning trees we can crumple up what is written before us and find a blank piece of paper, and on it we will write of our sadness and our fear. We will admit our weakness in the face of all that we have made and we will scratch out our apologies and our gratitude.

Then we will collect up everything that we think the future needs to be given, and we will carry it within us to barricades and to garden gates, to jail cells and to barn bays and to graves. We will find the fire that will make tomorrow worth struggling towards, in that dark, when we are bent and cold heaps of hungry, smoke smelling bone and sinew beneath taught and blackened skin. The madness of the world will grow raw, and real. Privation and awfulness will bloom, and we will endure it.

Do the Math of Peak Oil and Convince Yourself

A Step-By-Step Plan to
Calculate Hubbert’s Curve

Ing. Hans Zandvliet, April 2014

Table of Contents
Do the Math of Peak Oil and Convince Yourself
Table of Contents
Introduction
Download and Organize CDIAC Data
Methodology of Calculating Hubbert’s Curve
Do the Math!
Back to Our CDIAC Database
Defining the Linear Trend Line
Calculating Hubbert’s Curve
Matching Hubbert’s Curve with Historical Data
Combining Hubbert’s Curve and Historical Data in a Graph
Conclusions
Recent Developments
Bibliography

Introduction

Until Colin J. Campbell and Jean H. Laherrère published their paper The End of Cheap Oil in 1998 (Campbell & Laherrére, 1998), the petroleum geologist Marion King Hubbert (1903 – 1989) was all but forgotten, including his correct forecast – back in 1956 – of the US’s peak of oil production in 1970 (Hubbert, 1956). In their paper Campbell and Laherrère warned that:

Barring a global recession, it seems most likely that world production of conventional oil will peak during the first decade of the 21st century.”

It took another 12 years, but eventually the oil production optimist par excellence, the International Energy Agency (IEA, of the OECD countries), also had to admit the undeniable in their World Energy Outlook of 2010 (IEA, 2010):

Crude oil output reaches an undulating plateau of around 68–69 mb/d by 2020, but never regains its all‐time peak of 70 mb/d reached in 2006, while production of natural gas liquids (NGLs) and unconventional oil grows strongly.” (emphasis added)

Since Campbell’s and Laherrère’s paper, the peak of global oil production has been studied and commented on intensely. Centre stage in the debates has been Hubbert’s peak-oil calculation. However, in order to calculate Hubbert’s curve, one needs to have reliable petroleum production data and this is precisely the biggest problem. Oil reserves and production data of many countries and oil companies are kept secret, so one has to circumvent those obstacles by piecing together national import and export data from all countries in the world. Doable for a petroleum geologist, but not for an ordinary college student.

And this is a pity, because ordinary people cannot verify what the experts say about the timing of the peak of global oil production. The entire calculation remains a kind of magical mystery in which to either believe or not. The calculation itself is not the problem; any college student with a bit of affinity for mathematics should be able to do these calculations. The lack of reliable data is the problem.

Download and Organize CDIAC Data

Fortunately there is a fairly accurate solution to this problem, freely accessible to the general public. It’s not direct petroleum production data, but a closely related proxy: carbon emission data from liquid fossil fuels. On the basic assumption that burning one barrel of petroleum will always produce roughly the same amount of carbon-dioxide, it doesn’t really matter whether one calculates the peak of global oil production or the peak of global carbon emissions from liquid fossil fuels. The unit and vertical scale of the curve will be different, but the general shape of it and the timing of its peak will remain the same.

This database of carbon emissions from fossil fuels has been put together by CDIAC (Carbon Dioxide Information Analysis Centre), which “[…] has served as the primary climate-change data and information analysis center of the U.S. Department of Energy (DOE) since 1982.” So, CDIAC is not some kind of obscure website with dubious and poorly documented information, but an authoritative source used by climate scientists.

So, let’s go and take a look at CDIAC’s website: http://cdiac.ornl.gov/. On CDIAC’s home-page, in the pull-down menu “Data”, click “Fossil-Fuel CO2 Emissions”. Now, click “Global, Regional, and National Annual Time Series (1751-2010)” on top of the list on this page. Here you can choose between national, regional and global data. It’s worthwhile to have a look at some national data (like those of the U.K.), imagine the work to get these data together from historical archives and appreciate the magnitude of this database. (By the way, for the interested, it’s a nice cross-check to use the U.S.’s national emissions data to calculate the U.S.’s peak of oil production back in 1970.) For the purpose of this article, we click “Global” emission data. Now you can choose between three data formats: “Graphics”, “Digital Data (ASCII, Fixed Format)” and “Digital Data (ASCII, Comma-Delimited)”. Choose the third option and open the data file (presented in CSV format) with Excel. Now save the CSV-file as an XLS-file (or XLSX-file) in a map of your choice. Additionally, going back to the “Fossil-Fuel CO2 Emissions” page, click “Preliminary 2011 and 2012 Global & National Estimates” to update your database with two more years. This only requires a bit of copying and pasting of a few numbers between two Excel sheets.

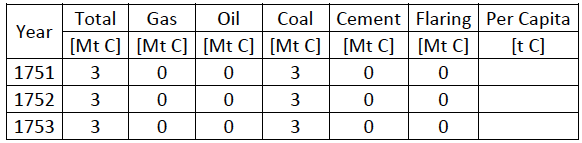
You now have a database of global carbon emissions from fossil fuels running from 1751 until 2012. The data differentiate between solid (like coal and peat), liquid (predominantly petroleum) and gaseous (mainly natural gas) fossil fuels. Row number 1 contains the headings of the table, but they are very long. For convenience, rename them to something shorter, like “Year, Total, Gas, Oil, Coal, Cement, Flaring and Per Capita” (cells A1:H1). Row number 2 mentions the source of the database. Copy this information away to somewhere on the right side of the table and use row 2 to mention the units of the data (million metric tons of carbon [Mt C] for all columns, except the per capita data in column H (after 1949): metric tons of carbon [t C]). Your Excel sheet should now look like this: 

Snap 2014-04-24 at 23.36.53

Methodology of Calculating Hubbert’s Curve

This article follows the explanations of Kenneth S. Deffeyes’ book Beyond Oil, the View from Hubbert’s Peak (Deffeyes, 2005). Deffeyes is a geologist and was a colleague and friend of Hubbert when he started his career at the Shell Research Lab in Houston, back in 1958. He wrote this book with the intention of explaining how Hubbert’s curve is calculated, so in this sense my article is not that novel. However, my aim is to get more into the details of how to actually do it, step by step, by means of an (Microsoft Office 2007) Excel sheet and (which I think is novel indeed) CDIAC’s carbon emission data from liquid fossil fuels.

Marion K. Hubbert discovered a peculiar pattern in oil production data, which allowed him to make a fairly accurate estimate of the amount of oil “yet to be discovered”. This almost sounds like a contradiction of terms: how can you know how much oil you are going to discover in future decades? Still, Hubbert discovered a linear trend in historical oil production data and a linear trend can easily be extended into the future. The following graph shows the pattern of oil production that Hubbert discovered: 

snap-2014-04-24-at-23-40-30

The vertical axis represents the oil production of a certain year divided by the cumulative oil production up to that year (“P” stands for annual oil production and “Q” means cumulative oil production). The horizontal axis represents the cumulative oil production in billions of barrels. 

Every dot represents the data of one year. At first the cumulative production is still little, so the quotient of P/Q gives relatively high outcomes (the blue dots in the graph). But the cumulative oil production keeps rising steadily, so the outcome of the quotient P/Q trends downward. Most importantly, from 1983 onward the dots start to line up fairly close to a straight line (the red dots in the graph) and form a linear trend (the black line in the graph).

If we extend this linear trend line until it reaches the horizontal axis, we can get an idea of the ultimate recoverable amount of oil. Upon reaching the horizontal axis, the quotient P/Q becomes zero, meaning that the annual oil production has become zero and no more oil can be produced. Therefore, this point indicates the total cumulative oil production at the end of the age of oil. Once you know how much oil you can ultimately produce, you have the key to calculate the future trend of annual oil production.

Do the Math!

In mathematical terms, the equation of a straight line is very simple: 

Snap 2014-04-25 at 00.02.06

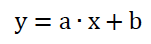
Where “b” is the y-value where the line intersects with the y-axis. In other words, the y-value when the x-value is zero.

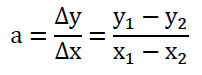
The “a” indicates the inclination of the line. When two points on the line are known, this inclination can be calculated as follows: 

Snap 2014-04-25 at 00.08.30

Or, the difference in y-values divided by the difference in x-values of the two known points. A negative outcome means the line slopes downward from left to right.

So, if we can define this linear trend line, we can calculate the future trend of oil production and to quote Deffeyes: “Since we want to estimate likely future trends, nothing beats a straight line on a graph.” No cooked up magic added, just straight forward mathematics.

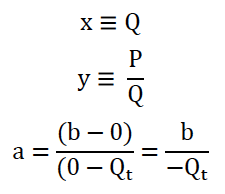
First we translate the mathematical terms into oil production terms, taking the intersections of the trend line with the x and y axes as the two known points: 

Snap 2014-04-25 at 00.15.54

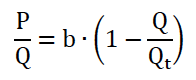
With these translations, the mathematical formula becomes the following oil production formula: 

Snap 2014-04-25 at 00.19.50

Or simplified: 

Snap 2014-04-25 at 06.50.27

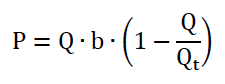
To calculate annual production data, you’d like to know “P”, not some incomprehensible quotient “P/Q”. This is easily achieved by multiplying both sides of the equation with “Q”: 

Snap 2014-04-25 at 08.05.35

To define “b” and “Qt”, we will make use of Excel’s linear trend line option. Then we will come back to this formula. 

Back to Our CDIAC Database

Time to roll up some sleeves, because now we’re starting to elaborate our Excel calculations. First, insert two new columns (E and F) to the right of the column with carbon emission data from liquid fossil fuels (D). Merge cells D1, E1 and F1, rename cell D2 into “P [Mt C]”. Name cell E2 “Q [Mt C]” and F2 “P/Q”. Your Excel sheet should now look like this: 

Snap 2014-04-25 at 08.08.59

The cumulative emission data are easily calculated by adding the emission data from the present year to the cumulative emission data of the previous year. Of course, 1751 doesn’t have a previous year in this database, so here (cell E3) we enter “0”. In cell E4 enter the Excel formula “= E3 + D4” and copy it down to all cells of column E (cells E5 till E264).

Petroleum was not yet discovered in 1751, so everything is still zero. As from 1870 the first emission data from liquid fossil fuels appear in the database. For convenience, you can split the window (menu tab “View”) to keep visible the heading of the table. Go to cell F122 (of the year 1870), enter the Excel formula “=D122/E122” and copy it down to the rest of column F (cells F123 till F264). Your Excel sheet (as from 1870) should now look like this:

Snap 2014-04-25 at 08.13.15

Defining the Linear Trend Line

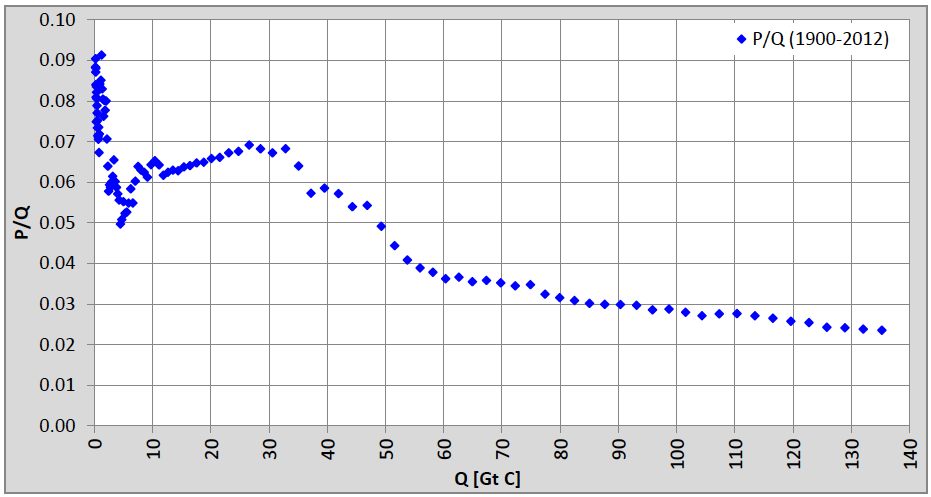
From the menu tab “Insert”, select the graph type “Scatter with only Markers” and a blank window opens up to design a chart. From the menu tab “Design” (“Chart Tools” are only visible when you select the chart window), click the button “Select Data” and a dialogue box opens. Click “Add” (under “Legend Entry (Series)”) and yet another dialogue opens in which you can type a name for the data series and the range of x-data and y-data. Under “Series Name” type something like “P/Q (1900-2012)”. I suggest making the graph as from 1900, because initially P/Q values start at 1, so the vertical scale becomes very large and the final and most relevant values between 0.04 and 0.02 become barely visible. For your x-data select the values E152:E264 and for your y-data select the values F152:F264. With some layout editing, your graph could now look like this: 

Snap 2014-04-25 at 08.16.41

Below a value of 0.04, you can see the dots lining up in a roughly linear way. When you move the cursor over the first dot just below the 0.04 line, an information box shows the coordinates of this dot: “Series “P/Q (1900-2012)” Point “55,931” (55,931, 0.0389)” Looking up these data in the table and you will find that they belong to the year 1983. So, as from 1983, the carbon emission data from liquid fossil fuels start to line up in a linear way.

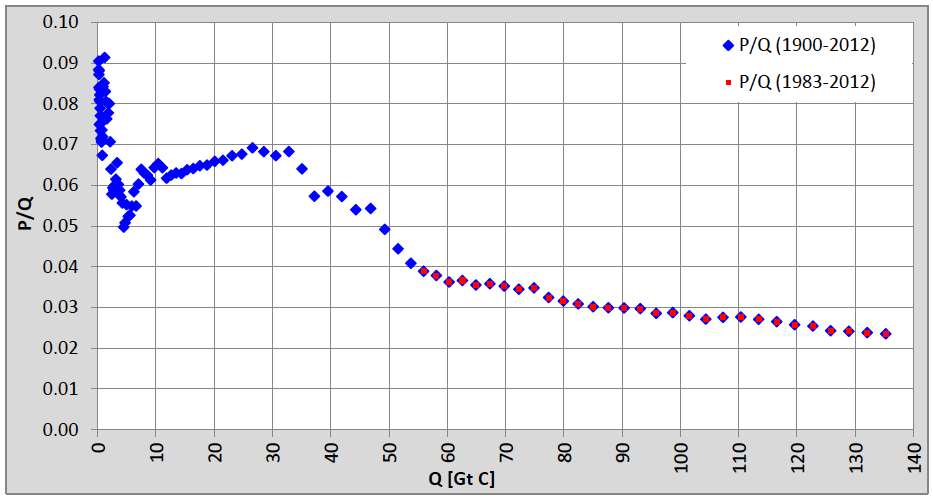
Before we can let Excel calculate a linear trend line, we first have to make a second graph of the 1983-2012 data. Do this in exactly the same way as the former graph, but only select the 1983-2012 data. Your graph should now look like this: 

Snap 2014-04-25 at 08.22.48

Of this second graph (of red dots) we let Excel calculate a linear trend line. You could calculate it yourself (the WikiPedia page “Linear Regression” will tell you all you need to know), but it’s very tiresome work and too farfetched for this article.

From the “Chart Tools” select the menu tab “Layout”, click the “Trendline” button, select “More Trendline Options” and select the “P/Q (1983-2012)” series. In the “Format Trendline” dialogue box, select the “Linear” type of trend line. At the bottom, tick the selection box “Display Equation on Chart” and close the dialogue box. You now see the linear trend line as a thin black line in your graph, together with its mathematical equation.

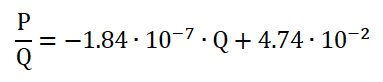
To improve the precision of this equation, right-click on it and from the quick menu that pops up, select “Format Trendline Label”. Now format the numbers of the formula as “Scientific” with two decimals (more decimals will only give a false impression of high accuracy). In this case scientific numbers come in quite handy because the P/Q-numbers are very small and the Q-numbers very large (so, don’t bother about them and let Excel do the job). Brightening up your chart a bit, your graph should now look like this:

Snap 2014-04-25 at 08.30.42

Now we have the values for “a” (-1.84·10-7) and “b” (4.74·10-2) and we can convert the mathematical trend line formula into our carbon emissions formula by changing “y” into “P/Q” and “x” into “Q”: 

Snap 2014-04-25 at 08.39.10

Annual emission data follow by multiplying both sides of the equation with “Q”: 

Snap 2014-04-25 at 09.01.17

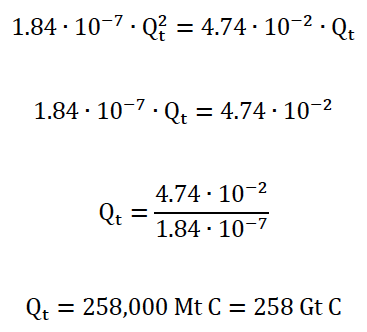
We can now calculate the ultimate amount of carbon emissions from liquid fossil fuels at the end of the age of oil (Qt). This is when P = 0: 

Snap 2014-04-25 at 09.05.52

So let’s solve this equation: 

Snap 2014-04-25 at 09.14.18

Calculating Hubbert’s Curve

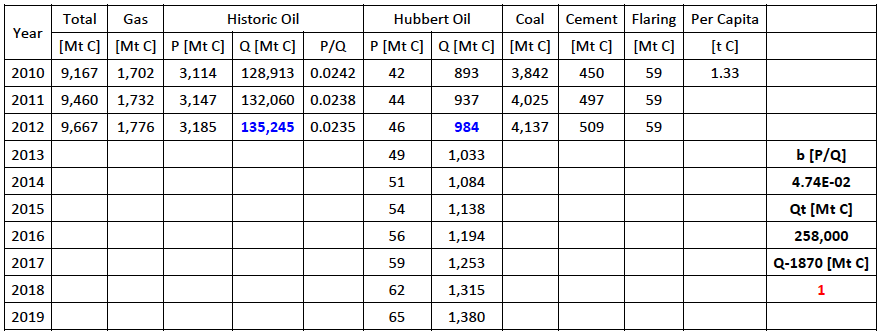
Now we can calculate Hubbert’s curve of CDIAC’s carbon emissions from liquid fossil fuels. First we not only want to calculate our Hubbert’s curve up to 2012, but through the end of this century, so we have to extend column A to 2100. The quickest way is to enter the Excel formula “=A264+1” in cell A265 and copy this formula down to the cells A266 till A352.

To the right of column F (with the P/Q data) we insert two new columns G and H. Merge cells G1 and H1 and type something like “Hubbert Oil”. Something similar you can do with cells D1, E1 and F1, naming them Historic Oil. In cell G2, write “P [Mt C]” and in cell H2 “Q [Mt C]”. Your table (as from 1870) should now look like this: 

Snap 2014-04-25 at 09.17.40

We need to put the values of “b” and “Qt” somewhere in the sheet. I put them in the following cells:

  • Cell M265: “b [P/Q]”
  • Cell M266: “4.74E-02” or “0.0474” (same value, different formats)
  • Cell M267: “Qt [Mt C]”
  • Cell M268: “258,000”
  • Cell M269: “Q-1870 [Mt C]”
  • Cell M270: “1” (for the time being, later you will see why)

In cell H122 enter “=M270” (To check, this is Hubbert’s cumulative emissions in the year 1870). Since the calculation of cumulative emissions remains the same, copy cell E123 to the cells H123 till H352.

We have to be careful now, because we’re going to use Q to calculate P and P to calculate Q, which results in a circular reference. However, given the right settings, Excel can easily deal with that. Click the Office button in the top-left corner of Excel and click the “Excel Options” button (bottom-right). Now click the “Formulas” button (top-left) and activate “Enable iterative calculation” (top-right). Usually it’s not necessary to tinker with the maximum amount of iterations and change. Leave the Excel Options by clicking “OK”.

Now we’re going to use the formula we arrived at on page 4 (repeated here, for convenience):

Snap 2014-04-25 at 09.29.13In Excel-format, enter in cell G122: 

Snap 2014-04-26 at 19.27.55

The dollar-signs mean that the row-numbers of these cells don’t change when the formula is copied. This is necessary, because M266 and M268 are the two numbers “b” and “Qt”, which occupy one fixed cell. Copy cell G122 down to the cells G123 till G352. Your table should now look like this: 

Snap 2014-04-25 at 09.40.16

You can see I gave the cells E264 and H264 a bold and blue format to let them stick out. Likewise I made cell M270 bold and red. It’s handy to do the same.

Matching Hubbert’s Curve with Historical Data

So what do we have now? We have a Hubbert’s curve (for sure, if you copy it down another century), but it’s not yet matched with the calendar years of historic emission data. To imagine what needs to be done, we need to move our Hubbert’s curve horizontally across the chart, until it best fits with the historical data. The most acurate way to do this is to adjust the initial value of cumulative emissions in 1870 (we set it to “1”, for time being) such that Hubbert’s cumulative emissions in 2012 equal the historical cumulative emissions of that same year (that’s why I marked them blue and bold for comparison).

Now finding this match is a matter of changing the value “1” of cell M270 and seeing what happens. To avoid having to scroll up and down between 1870 and 2012, I placed this adjustment cell at M270, while H122 uses M270 as its starting value (now you see why).

So, give it a try and change cell M270 from 1 to 10. You should now see that the blue cell H264 has increased from 984 to 9,498. So, we’re heading in the right direction, but we’re not there yet. Try 100 instead of 10. H264 has now increased to 70,639. It seems we’re half way now, so let’s try 200. H264 is now 110,198, so we’re getting there. Say, 250? H264 = 124,157. M270 = 300? H264 = 135,637. That’s just a tad too much! M270 = 299? H264 = 135,427. Still a tiny bit too much. M270 = 298? H264 = 135,217. For the record: M270 = 297? H264 = 135,006. So, 298 is a much closer match than 297: M270 = H122 = 298! We have matched Hubbert’s curve horizontally with the historical emission data.

Now, curious in which year Hubbert’s peak occurs? Look at the annual emissions of Hubbert’s curve in column G. In which year does it reach its highest value? In 2010! 

Combining Hubbert’s Curve and Historical Data in a Graph

From the tab menu “Insert”, select a 2-D line graph. From the Chart Tools select the menu tab “Design”, click the button “Select Data” and click the button “Add” (under “Legend Entries (Series)”). In the dialogue box that opens up, enter as a “Series Name” something like “Hubbert’s Curve (1870-2100)”. Select the data cells G122 till G352. You can now see you have added a legend entry, but you still have to edit the “Horizontal (Category) Axis Labels”. So, click on the “Edit” button and select the cells A122 till A352.

Now add a second data series of the historic annual emissions of cells D122 till D264 (Chart Tools -> Design -> Select Data). However, select as its calendar series the same range of years as the Hubbert’s curve (1870-2100): cells A122 till A352. After tidying up a bit, your chart should look like this: 

Snap 2014-04-25 at 09.44.18

Conclusions

Based on CDIAC’s global data of carbon emissions from liquid fossil fuels (i.e. predominantly petroleum) and Marion King Hubbert’s method of calculating the oil production curve, we have arrived at a theoretical emissions peak of carbon from liquid fossil fuels (i.e. oil production peak) in 2010.

Compared to earlier forecasts of oil-geologists and other experts using Hubbert’s methodology, the calculations based on CDIAC data get quite close to the mark. Most of these experts (like Collin Campbell, Jean Laherrère, Kenneth Deffeyes and Matthew Simmons) forecast peak-oil between 2005 and 2010, so the CDIAC data turn out to be a fairly reliable source for this purpose.

Theoretically, we’re already 4 years past the peak, although historical data still show growth. This is very well possible for a limited period of time. Given the frantic drilling and fracking spree we’ve seen since about 2007, it’s not even surprising. Extraction methods have improved as well over the last decade or so: horizontal drilling, hydraulic fracturing, deep-sea drilling, more accurate 3D soundings of geological formations, etc. The much higher oil price has also made it worthwhile to drill for harder-to-get oil. So, the ultimately recoverable amount of oil has increased indeed (though I don’t know by how much) and this is not (yet) reflected in the historical data.

Recent Developments

Since a few years, there has been a lot of talk that there are so much fossil fuel reserves left that we can only responsibly burn about one third of them (leaving two-thirds in the ground) in order to keep global warming below 2°C (IEA, 2012). This also implies that the shares of fossil fuel companies are over-valued by up to 80% (Carbon Tracker, 2012; Carbon Tracker, 2013). However, there are several caveats against this analysis:

  1. The reserves are based on stated reserves of fossil fuel companies and governments, but we don’t know to what extent these reserves are overstated. Of the OPEC-countries it’s quite obvious that (for political motives) they overstated their reserves dramatically between 1987 and 1990. The sudden jumps in stated reserves were not accompanied by announcements of newfound oil fields. Also, it doesn’t add up that oil reserves have remained virtually constant during decades of high rates of oil production and low rates of new discoveries:Snap 2014-04-25 at 09.57.02

    Source: own compilation of U.S. Energy Information Administration data
    (EIA, 2013)

  2. It’s not the amount of fossil fuel reserves that counts; it’s the rate at which they can be extracted. The big oilfields with high quality and easy to get petroleum are mostly depleted. We are now looking for ever smaller fields in ever harder to reach locations, like the ocean floors and the arctic. When it’s ever harder to get the oil, this will result in a slowdown of the rate of extraction (i.e. going down the other side of Hubbert’s curve).
  3. The Energy Return on Energy Invested (EROEI) has already gone down seriously. The EROEI is an analysis of how much energy it takes to produce fossil energy (produce materials and operate machinery needed to construct the facilities to drill for oil and get it to the market, like drilling rigs, pipelines, oil tankers, refineries, etc.) and how much energy you get from all this. The EROEI used to be 100:1 in the 1930s – 1950s. Talking about tar sands the EROEI is already down to something like 5:1. This means that for every 5 barrels of oil (equivalent) one has to be invested into getting it, 4 are left as “profit”. Once it takes one barrel of oil to get one barrel of oil, there won’t be any profit left and it’s pointless to continue. Actually well before this point (say 2:1) because an oil company needs to sell at least some oil to pay for the investments in wages and equipment.
  4. The cost of oil extraction is already such that the oil price has to be above $100/barrel in order to be profitable. On the other hand, how high a fossil fuel price can the world economy afford in order to function healthily? We’ve seen the world economy crash into the Great Recession in 2008, when the oil price soared to $147/barrel (I daresay it wasn’t exactly a housing bubble…) and the price is again hovering around $100/barrel. No wonder economic growth doesn’t want to pick up! Oil consumption simply responds to the economic law of supply and demand. When oil gets too expensive, people will turn to cheaper alternatives and oil consumption goes down (the other side of Hubbert’s curve) just the same.

So there are many ways to look at peak-oil (environmental, geological, economical, social, etc.). One way doesn’t exclude the other, so I surely don’t want to contribute to infighting between peak-oilists and environmentalists. Both are right and allies to the same cause: we have to think hard and take swift action to create a sustainable way of living in harmony with the world wide web of life on our planet, in order to prove that human intelligence was not an evolutionary error.

Bibliography

Campbell, Colin J., and Jean H. Laherrère. “The End of Cheap Oil.” Scientific American 278.3 (1998): 78-83. Print. Download at http://josiah.berkeley.edu/2007Fall/ER200N/Readings/Campbell_1998.pdf

“Carbon Dioxide Information Analysis Center.” (CDIAC). Web. 24 Apr. 2014. Website http://cdiac.ornl.gov/

Global Fossil-Fuel CO2 Emissions. CDIAC. Web. 24 Apr. 2014. Website http://cdiac.ornl.gov/trends/emis/tre_glob_2010.html

The Crisis of Civilization. Dr. Nafeez Mosaddeq Ahmed. Dead Dean Films, 2011. Film. Watch at http://www.youtube.com/watch?v=pMgOTQ7D_lk

A Crude Awakening. Dir. Basil Gelpke and Ray McCormack. 2006. Film. Watch at http://www.youtube.com/watch?v=7qGM9ypR-UI

Crude Impact. Dir. Jennifer Jandak Wood, James Jandak Wood, and Joanne Shen. 2006. Film. Watch at http://www.youtube.com/watch?v=bvyDH8-y-AE

Deffeyes, Kenneth S. Beyond Oil: The View from Hubbert’s Peak. New York: Hill and Wang, 2005. Print.

Hubbert, M. King. Nuclear Energy and the Fossil Fuels. Houston: Shell Development, Exploration and Production Research Division, 1956. Print. Download at http://www.hubbertpeak.com/hubbert/1956/1956.pdf

International Energy Statistics. EIA, 2013. Data. Download at http://www.eia.gov/cfapps/ipdbproject/iedindex3.cfm?tid=5&pid=57&aid=6&cid=CG9,&syid=1980&eyid=2013&unit=BB

Unburnable Carbon – Are the World’s Financial Markets Carrying a Carbon Bubble? Rep. Carbon Tracker. 2011. Print. Download at http://www.carbontracker.org/wp-content/uploads/downloads/2011/07/Unburnable-Carbon-Full-rev2.pdf

Unburnable Carbon 2013: Wasted Capital and Stranded Assets. Rep. Carbon Tracker. Print. Download at http://carbontracker.live.kiln.it/Unburnable-Carbon-2-Web-Version.pdf

World Energy Outlook 2010, Executive Summary. IEA, 2010. Print. Download at http://www.iea.org/textbase/npsum/weo2010sum.pdf

World Energy Outlook 2012, Executive Summary. IEA, 2012. Print. Download at http://www.iea.org/textbase/npsum/weo2012sum.pdf

Overpopulated by Homo Colossus

Tags

, , , , , , , , , , , ,

Snap 2014-04-01 at 21.56.52 Do citizens of industrialized, consumerist nations have the moral authority to lecture the world about overpopulation, singling it out as the root of all the world’s problems? William Catton coined the term Homo colossus to describe those living in the industrialized world whose consumption of resources is disproportionately greater than those in the so-called undeveloped world:

Snap 2014-04-20 at 11.42.06 In his book Endgame, Derrick Jensen points out that the argument of overpopulation becomes rather meaningless unless it is framed within the context of consumption levels:

Snap 2014-04-20 at 09.24.25 If we take a look at who is actually pushing the environment to collapse according to their consumption levels, it becomes clear by the numbers that the real planet destroyers are not the teeming masses of the Third World, but industrial civilization’s energy gluttons driving their SUV’s, checking their stock portfolios on the internet, and wagging their finger at the huddled masses who have been corralled into megacities because globalization wiped out their indigenous means of subsistence:

consumption-inequality-2005-pie

consumption-inequality-2005-bar

…What is immediately apparent from Chart 1[above] is that the 10 percent of the world’s population with the highest income, some 700 million people, are responsible for the overwhelmingly majority of the problem. It should be kept in mind that this is not just an issue of the rich countries. Very wealthy people live in almost all countries of the world—the wealthiest person in the world is Mexican, and there are more Asians than North Americans with net worth over $100 million. When looked at from a global perspective, the poor become essentially irrelevant to the problem of resource use and pollution. The poorest 40 percent of people on Earth are estimated to consume less than 5 percent of natural resources. The poorest 20 percent, about 1.4 billion people, use less than 2 percent of natural resources. If somehow the poorest billion people disappeared tomorrow, it would have a barely noticeable effect on global natural resource use and pollution. (It is the poor countries, with high population growth, that have low per capita greenhouse gas emissions.22) However, resource use and pollution could be cut in half if the richest 700 million lived at an average global standard of living.

Thus, we are forced to conclude that when considering global resource use and environmental degradation there really is a “population problem.” But it is not too many people—and certainly not too many poor people—but rather too many rich people living too “high on the hog” and consuming too much. Thus birth control programs in poor countries or other means to lower the population in these regions will do nothing to help deal with the great problems of global resource use and environmental destruction… – link

By far, the wealthy have the world’s largest environmental footprint :

The Congressional Budget Office estimates that the carbon footprint of the top quintile is over three times that of the bottom. Even in relatively egalitarian Canada, the top income decile has a mobility footprint nine times that of the lowest, a consumer goods footprint four times greater, and an overall ecological footprint two-and-a-half times larger. Air travel is frequently pegged as one of the most rapidly growing sources of carbon emissions, but it’s not simply because budget airlines have “democratized the skies”–rather, flying has truly exploded among the hyper-mobile affluent. Thus in Western Europe, the transportation footprint of the top income earners is 250 percent of that of the poor. And global carbon emissions are particularly uneven: the top five hundred million people by income, comprising about 8 percent of global population, are responsible for 50 percent of all emissions. It’s a truly global elite, with high emitters present in all countries of the world.

In the post Earth to Humans: “Get Off Your Merry-Go-Round Ride to Extinction”, I quoted a well-reasoned article by Devon G. Peña who explained the self-serving and hypocritical stance taken by the capitalist industrialized nations regarding the issue of overpopulation. The root causes driving mankind to extinction are completely sidestepped:

…In climate change debates, overpopulation arguments serve to delay making structural changes in North and South away from the extraction and use of fossil fuels; to explain the failure of carbon markets to tackle the problem; to justify increased and multiple interventions in the countries deemed to hold the surplus people; and to excuse those interventions when they cause further environmental degradation, migration or conflict.

As such, population theory is far more than a theory or a principle. It is above all a political strategy that obscures the relationships of power between different groups in societies, whether these be local, national, global, while at the same time justifying those political relationships that allow certain groups to dominate others structurally, be they men over women, property owners over commoners, or ‘us’ over ‘them’. The “too many” are hardly ever the speakers, they are always the Other.

This partially explains why those considered to be surplus are not those who profit from continued fossil fuel extraction but those most harmed by it and by climate change

As was shown in the post The Biophysics of Civilization, Money = Energy, and the Inevitability of Collapse, GDP and money are tied to energy consumption and CO2 emissions. Climate change is the greatest threat to humanity and our economic model and profligate way of life are on a collision course with catastrophe. Realistic solutions require dealing with the root of the problem, not the symptoms. Geoengineering, carbon trading schemes, and GMO’s are technocapitalist solutions to climate change. Focusing on overpopulaion ignores the socio-economic system behind all the exploitation and destruction.

…It is not surprising, however, that a worsening climate situation is often attributed not to continued fossil fuel extraction but to too many people. Whenever global environmental crises, Third World poverty or world hunger are at issue, whenever conflict, migration or economic growth are discussed, economists, demographers, planners, corporate financiers and political pundits (at least in the North) frequently invoke overpopulation.

Over 200 years ago, at a time of immense social, political and economic upheavals and deprivation in England triggered by the enclosure of common lands and forests on which peasant livelihoods depended, free market economist Thomas Malthus wrote a story about how nature and humans interact. The punch line was his mathematical analogy for the disparity between human and food increases. Harnessing politics to mathematics, he provided a spuriously neutral set of arguments for promoting a new political correctness – one that denied the shared rights of everyone to subsistence, sanctioning instead the rights of the “deserving” over the “undeserving”, with the market as arbiter of entitlements. The poor were poor because they lacked restraint and discipline, not because of privatisation. This is the essence of the overpopulation argument.

Today, a range of industries use the same argument to colonise the future for their particular interests and to privatise commonally-held goods. In agriculture, for instance, the talk is of extra mouths in the South causing global famine — unless biotechnology companies have the right to patent and genetically-engineer seeds. With respect to water, growing numbers of thirsty slum dwellers are held to threaten water wars — unless water resources are handed over to private sector water companies. And in climate, the talk is of teeming Chinese and Indians causing whole cities to be lost to flooding through their greenhouse gas emissions — unless polluting companies are granted property rights in the atmosphere through carbon-trading schemes and carbon offsets. These are the tools of the main official approach to the climate crisis that aims to build a global carbon market worth trillions of dollars.

Two centuries ago, Malthus was compelled to admit that his mathematical and geometric series of increases in food and humans were not observable in any society. He acknowledged that his “power of number” was just an image — an admission demographers have since confirmed. And for over 200 years, his theory and arguments — that it is the number of people that cause resource scarcity — have been refuted endlessly by demonstrations that any problem attributed to human numbers can more convincingly be explained by social inequality, or that the statistical correlation is ambiguous. Malthus’s greatest achievement was in fact to obscure the roots of poverty, inequality and environmental deterioration. The “war-room” mentality generated by predictions of scarcity-driven apocalypse has always diverted attention away from the awkward social and environmental history of discredited policies and projects – a more important focus of study.

Frequently left out of discussions about tackling malnutrition, hunger, starvation and famine, for instance, are the maldistribution of the world’s food supplies, skewed access to land, trade policies, the hazards of devoting land to agrofuel or carbon offset production, unequal access to money to buy food, and commodity speculation.

If over one billion people do not have access to safe drinking water, it is because water, like food, flows to those with the most bargaining power: industry and bigger farmers first, richer consumers second, and the poor last, whose water is polluted by industrial effluent, exported in foodstuffs or poured down the drain through others’ wasteful consumption… – link

And of course we can always wash our hands of everything by saying humans, driven by base biological urges, are inherently aggressive, selfish, and hierarchical by nature. We can blame our fossil fuel consumption on the optimal foraging theory and the lethal mutation of higher intelligence. We can excuse our self-destructive behavior on account of evolutionary blind spots such as faulty human brain circuitry with its numerous cognitive biases and inability to perceive long-term threats like climate change. We can say that “complex global human systems” are beyond anyone’s control and therefore cannot be altered or stopped. In other words, we can rationalize inaction and put forth many reasons for why we are helpless as our manmade economic system speeds toward the cliff, but as the masses see the system for what it really is, the facade becomes harder and harder to maintain. The mantra of business-as-usual is becoming a curse for most, and if continued on for much longer will most certainly be a death sentence for all.

tumblr_n3vnfes2R71qbmgeto6_1280

A Time of Seamless Black

Tags

, , , , , , , , , , , , ,

post-apocalyptic-worldHumans live on hope and without it they fall into depression, oftentimes taking their own lives. In ‘The Evolution and Psychology of Self-Deception‘, optimism bias is said to be a defense or coping mechanism for survival. Most turn to religion for the ultimate hope of an afterlife nirvana. Voluntarily and unflinchingly holding one’s eyes open to the searing light of reality is an unnatural act for humans. For many, simply dealing with everyday life and the stress of surviving the concrete jungle is enough to drive them to despair, madness, and suicide. Whether they realize it or not, any normal person taking in the full scope of the multiple crises we face is surely prone to depression to some degree or another. I am now finding that I have to periodically distance myself from blogging on these subjects because it’s affecting my personal relationships as well as my mental/physical health. Suicide is on the rise in the modern world:

Death on the Farm:
…Since that crisis, the suicide rate for male farmers has remained high: just under two times that of the general population. And this isn’t just a problem in the U.S.; it’s an international crisis. India has had more than 270,000 farmer suicides since 1995. In France, a farmer dies by suicide every two days. In China, farmers are killing themselves to protest the government’s seizing of their land for urbanization. In Ireland, the number of suicides jumped following an unusually wet winter in 2012 that resulted in trouble growing hay for animal feed. In the U.K., the farmer suicide rate went up by 10 times during the outbreak of foot-and-mouth disease in 2001, when the government required farmers to slaughter their animals. And in Australia, the rate is at an all-time high following two years of drought.

Suicide Rate Rises Sharply in U.S.:
From 1999 to 2010, the suicide rate among Americans ages 35 to 64 rose by nearly 30 percent, to 17.6 deaths per 100,000 people, up from 13.7. Although suicide rates are growing among both middle-aged men and women, far more men take their own lives.

Why Suicide Has Become an Epidemic–and What We Can Do to Help:
…We know, thanks to a growing body of research on suicide and the conditions that accompany it, that more and more of us are living through a time of seamless black: a period of mounting clinical depression, blossoming thoughts of oblivion and an abiding wish to get there by the nonscenic route. Every year since 1999, more Americans have killed themselves than the year before, making suicide the nation’s greatest untamed cause of death. In much of the world, it’s among the only major threats to get significantly worse in this century than in the last…

…This year, America is likely to reach a grim milestone: the 40,000th death by suicide, the highest annual total on record, and one reached years ahead of what would be expected by population growth alone. We blew past an even bigger milestone revealed in November, when a study lead by Ian Rockett, an epidemiologist at West Virginia University, showed that suicide had become the leading cause of “injury death” in America. As the CDC noted again this spring, suicide outpaces the rate of death on the road—and for that matter anywhere else people accidentally harm themselves. Somewhere Ralph Nader is smiling, but the takeaway is darkly profound: we’ve become our own greatest danger.

This development evades simple explanation. The shift in suicides began long before the recession, for example, and although the changes accelerated after 2007, when the unemployment rate began to rise, no more than a quarter of those new suicides have been tied to joblessness, according to researchers. Guns aren’t all to blame either, since the suicide rate has grown even as the portion of suicides by firearm has remained stable.

The fact is, self-harm has become a worldwide concern. This emerged in the new Global Burden of Disease report, published in The Lancet this past December. It’s the largest ever effort to document what ails, injures, and exterminates the species. But allow me to save you the reading. Humankind’s biggest health problem is humankind…

That last article I quoted above, from a mainstream periodical, has more truth written between the lines than its author even realizes. Humans are their own worst enemy and perhaps the rise of suicides across the globe is a reflection of our ecocidal culture, one that values money over life and reduces everything to a financial statistic. Capitalism is the most pervasive religion on the planet today. Most living at the end of modern history have adopted the ruling elite’s belief system which says that all problems can and will be solved via the “free market” and human ingenuity, but as one Indian philosopher of the 21st century wisely observed:

“Nature shrinks as capital grows. The growth of the market cannot solve the very crisis it creates.” ~ Vandana Shiva

People are a reflection of their environment, and so it is in the waning days of industrial civilization and predatory capitalism that many will no longer have the will to go on. From an interesting obituary written by a friend of Michael C. Ruppert:

…I look at Ruppert’s life, his hard struggle, his victories and his short-comings. I wish we were closer in his final couple of years. I loved him. I say the following with love. I say the following because I don’t want to know any more great truth-loving writers to die this way. If you have a drinking problem, hit a meeting. Reach out. It worked for me, to stop flailing about, running from city to country to city, always moving, thinking a big move is going to change things. Get centered. Pray and meditate. Be still.

Something snapped in Ruppert sometime later in that decade, after the book. He moved to Venezuela, in rushed effort to seek political asylum from the Chavez government. Ruppert probably wasn’t anti-imperialist enough for their tastes, at least not in a leftist way. Oh, and the CIA/DIA family background probably didn’t help.

I wept. I felt rage today. I was mad at you, Mike, going out this way. It was too similar to Gary Webb, to Jim Hatfield the Bush biographer. I don’t want this pattern. Tell me it’s not the fate for writers of deep truth, to die, alone, shooting their brains out, because they went deep and hard after the invisible forces, the slithering stag. The hunter became hunted by the dragon.

No. Mike will be remembered for his discipline, his writing, his development of a critical paradigm. Our society is stronger for the deep analysis. In the same way that Ruppert investigated Gary Webb’s death, it’s up to us now to do the scientific and careful analysis of the crime scene. To pick up where he left off, and wake up to a new view of the matrix…

In their search for the truth, perhaps some travel too far down the rabbit hole of civilizational and environmental collapse to ever escape its malignant shadow; it consumes them like a cancer. A copy of Ruppert’s suicide letter can be read here. His research and thinking lead him to the inner sanctum of dark revelation and the unsettling details of civilization’s trajectory. The vaporware dreams of a technological utopia will most certainly go up in smoke as social unrest and resource wars consume the nations of the world in an age of climate chaos. The evil genius of mankind will be revealed in evermore lethal and destructive ways to kill his fellow man. And waiting in the wings of industrial civilization’s collapse is the toxic and radioactive tsunami from an aging fleet of nuclear reactors dependent on a functioning electric grid. Humans are capable of great acts of compassion and selflessness as well as great acts of cruelty and violence. The system rewards sociopathic behavior at the expense of the health of the whole. Ignoring such stark realities won’t change our odds for survival.

RIP Michael C. Ruppert, Feb. 3, 1951- April 13, 2014

Full Documentary of ‘Apocalypse, Man’:

Error
This video doesn’t exist