
A Step-By-Step Plan to
Calculate Hubbert’s Curve
Ing. Hans Zandvliet, April 2014
Table of Contents
Do the Math of Peak Oil and Convince Yourself
Table of Contents
Introduction
Download and Organize CDIAC Data
Methodology of Calculating Hubbert’s Curve
Do the Math!
Back to Our CDIAC Database
Defining the Linear Trend Line
Calculating Hubbert’s Curve
Matching Hubbert’s Curve with Historical Data
Combining Hubbert’s Curve and Historical Data in a Graph
Conclusions
Recent Developments
Bibliography
Introduction
Until Colin J. Campbell and Jean H. Laherrère published their paper The End of Cheap Oil in 1998 (Campbell & Laherrére, 1998), the petroleum geologist Marion King Hubbert (1903 – 1989) was all but forgotten, including his correct forecast – back in 1956 – of the US’s peak of oil production in 1970 (Hubbert, 1956). In their paper Campbell and Laherrère warned that:
“Barring a global recession, it seems most likely that world production of conventional oil will peak during the first decade of the 21st century.”
It took another 12 years, but eventually the oil production optimist par excellence, the International Energy Agency (IEA, of the OECD countries), also had to admit the undeniable in their World Energy Outlook of 2010 (IEA, 2010):
“Crude oil output reaches an undulating plateau of around 68–69 mb/d by 2020, but never regains its all‐time peak of 70 mb/d reached in 2006, while production of natural gas liquids (NGLs) and unconventional oil grows strongly.” (emphasis added)
Since Campbell’s and Laherrère’s paper, the peak of global oil production has been studied and commented on intensely. Centre stage in the debates has been Hubbert’s peak-oil calculation. However, in order to calculate Hubbert’s curve, one needs to have reliable petroleum production data and this is precisely the biggest problem. Oil reserves and production data of many countries and oil companies are kept secret, so one has to circumvent those obstacles by piecing together national import and export data from all countries in the world. Doable for a petroleum geologist, but not for an ordinary college student.
And this is a pity, because ordinary people cannot verify what the experts say about the timing of the peak of global oil production. The entire calculation remains a kind of magical mystery in which to either believe or not. The calculation itself is not the problem; any college student with a bit of affinity for mathematics should be able to do these calculations. The lack of reliable data is the problem.
Download and Organize CDIAC Data
Fortunately there is a fairly accurate solution to this problem, freely accessible to the general public. It’s not direct petroleum production data, but a closely related proxy: carbon emission data from liquid fossil fuels. On the basic assumption that burning one barrel of petroleum will always produce roughly the same amount of carbon-dioxide, it doesn’t really matter whether one calculates the peak of global oil production or the peak of global carbon emissions from liquid fossil fuels. The unit and vertical scale of the curve will be different, but the general shape of it and the timing of its peak will remain the same.
This database of carbon emissions from fossil fuels has been put together by CDIAC (Carbon Dioxide Information Analysis Centre), which “[…] has served as the primary climate-change data and information analysis center of the U.S. Department of Energy (DOE) since 1982.” So, CDIAC is not some kind of obscure website with dubious and poorly documented information, but an authoritative source used by climate scientists.
So, let’s go and take a look at CDIAC’s website: http://cdiac.ornl.gov/. On CDIAC’s home-page, in the pull-down menu “Data”, click “Fossil-Fuel CO2 Emissions”. Now, click “Global, Regional, and National Annual Time Series (1751-2010)” on top of the list on this page. Here you can choose between national, regional and global data. It’s worthwhile to have a look at some national data (like those of the U.K.), imagine the work to get these data together from historical archives and appreciate the magnitude of this database. (By the way, for the interested, it’s a nice cross-check to use the U.S.’s national emissions data to calculate the U.S.’s peak of oil production back in 1970.) For the purpose of this article, we click “Global” emission data. Now you can choose between three data formats: “Graphics”, “Digital Data (ASCII, Fixed Format)” and “Digital Data (ASCII, Comma-Delimited)”. Choose the third option and open the data file (presented in CSV format) with Excel. Now save the CSV-file as an XLS-file (or XLSX-file) in a map of your choice. Additionally, going back to the “Fossil-Fuel CO2 Emissions” page, click “Preliminary 2011 and 2012 Global & National Estimates” to update your database with two more years. This only requires a bit of copying and pasting of a few numbers between two Excel sheets.
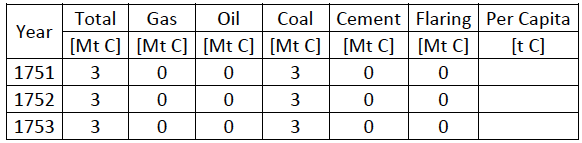
You now have a database of global carbon emissions from fossil fuels running from 1751 until 2012. The data differentiate between solid (like coal and peat), liquid (predominantly petroleum) and gaseous (mainly natural gas) fossil fuels. Row number 1 contains the headings of the table, but they are very long. For convenience, rename them to something shorter, like “Year, Total, Gas, Oil, Coal, Cement, Flaring and Per Capita” (cells A1:H1). Row number 2 mentions the source of the database. Copy this information away to somewhere on the right side of the table and use row 2 to mention the units of the data (million metric tons of carbon [Mt C] for all columns, except the per capita data in column H (after 1949): metric tons of carbon [t C]). Your Excel sheet should now look like this:
Methodology of Calculating Hubbert’s Curve
This article follows the explanations of Kenneth S. Deffeyes’ book Beyond Oil, the View from Hubbert’s Peak (Deffeyes, 2005). Deffeyes is a geologist and was a colleague and friend of Hubbert when he started his career at the Shell Research Lab in Houston, back in 1958. He wrote this book with the intention of explaining how Hubbert’s curve is calculated, so in this sense my article is not that novel. However, my aim is to get more into the details of how to actually do it, step by step, by means of an (Microsoft Office 2007) Excel sheet and (which I think is novel indeed) CDIAC’s carbon emission data from liquid fossil fuels.
Marion K. Hubbert discovered a peculiar pattern in oil production data, which allowed him to make a fairly accurate estimate of the amount of oil “yet to be discovered”. This almost sounds like a contradiction of terms: how can you know how much oil you are going to discover in future decades? Still, Hubbert discovered a linear trend in historical oil production data and a linear trend can easily be extended into the future. The following graph shows the pattern of oil production that Hubbert discovered:

The vertical axis represents the oil production of a certain year divided by the cumulative oil production up to that year (“P” stands for annual oil production and “Q” means cumulative oil production). The horizontal axis represents the cumulative oil production in billions of barrels.
Every dot represents the data of one year. At first the cumulative production is still little, so the quotient of P/Q gives relatively high outcomes (the blue dots in the graph). But the cumulative oil production keeps rising steadily, so the outcome of the quotient P/Q trends downward. Most importantly, from 1983 onward the dots start to line up fairly close to a straight line (the red dots in the graph) and form a linear trend (the black line in the graph).
If we extend this linear trend line until it reaches the horizontal axis, we can get an idea of the ultimate recoverable amount of oil. Upon reaching the horizontal axis, the quotient P/Q becomes zero, meaning that the annual oil production has become zero and no more oil can be produced. Therefore, this point indicates the total cumulative oil production at the end of the age of oil. Once you know how much oil you can ultimately produce, you have the key to calculate the future trend of annual oil production.
Do the Math!
In mathematical terms, the equation of a straight line is very simple:
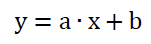
Where “b” is the y-value where the line intersects with the y-axis. In other words, the y-value when the x-value is zero.
The “a” indicates the inclination of the line. When two points on the line are known, this inclination can be calculated as follows:
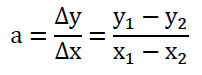
Or, the difference in y-values divided by the difference in x-values of the two known points. A negative outcome means the line slopes downward from left to right.
So, if we can define this linear trend line, we can calculate the future trend of oil production and to quote Deffeyes: “Since we want to estimate likely future trends, nothing beats a straight line on a graph.” No cooked up magic added, just straight forward mathematics.
First we translate the mathematical terms into oil production terms, taking the intersections of the trend line with the x and y axes as the two known points:
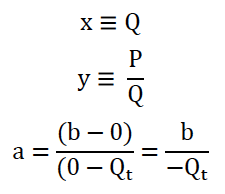
With these translations, the mathematical formula becomes the following oil production formula:

Or simplified:

To calculate annual production data, you’d like to know “P”, not some incomprehensible quotient “P/Q”. This is easily achieved by multiplying both sides of the equation with “Q”:

To define “b” and “Qt”, we will make use of Excel’s linear trend line option. Then we will come back to this formula.
Back to Our CDIAC Database
Time to roll up some sleeves, because now we’re starting to elaborate our Excel calculations. First, insert two new columns (E and F) to the right of the column with carbon emission data from liquid fossil fuels (D). Merge cells D1, E1 and F1, rename cell D2 into “P [Mt C]”. Name cell E2 “Q [Mt C]” and F2 “P/Q”. Your Excel sheet should now look like this:

The cumulative emission data are easily calculated by adding the emission data from the present year to the cumulative emission data of the previous year. Of course, 1751 doesn’t have a previous year in this database, so here (cell E3) we enter “0”. In cell E4 enter the Excel formula “= E3 + D4” and copy it down to all cells of column E (cells E5 till E264).
Petroleum was not yet discovered in 1751, so everything is still zero. As from 1870 the first emission data from liquid fossil fuels appear in the database. For convenience, you can split the window (menu tab “View”) to keep visible the heading of the table. Go to cell F122 (of the year 1870), enter the Excel formula “=D122/E122” and copy it down to the rest of column F (cells F123 till F264). Your Excel sheet (as from 1870) should now look like this:

Defining the Linear Trend Line
From the menu tab “Insert”, select the graph type “Scatter with only Markers” and a blank window opens up to design a chart. From the menu tab “Design” (“Chart Tools” are only visible when you select the chart window), click the button “Select Data” and a dialogue box opens. Click “Add” (under “Legend Entry (Series)”) and yet another dialogue opens in which you can type a name for the data series and the range of x-data and y-data. Under “Series Name” type something like “P/Q (1900-2012)”. I suggest making the graph as from 1900, because initially P/Q values start at 1, so the vertical scale becomes very large and the final and most relevant values between 0.04 and 0.02 become barely visible. For your x-data select the values E152:E264 and for your y-data select the values F152:F264. With some layout editing, your graph could now look like this:
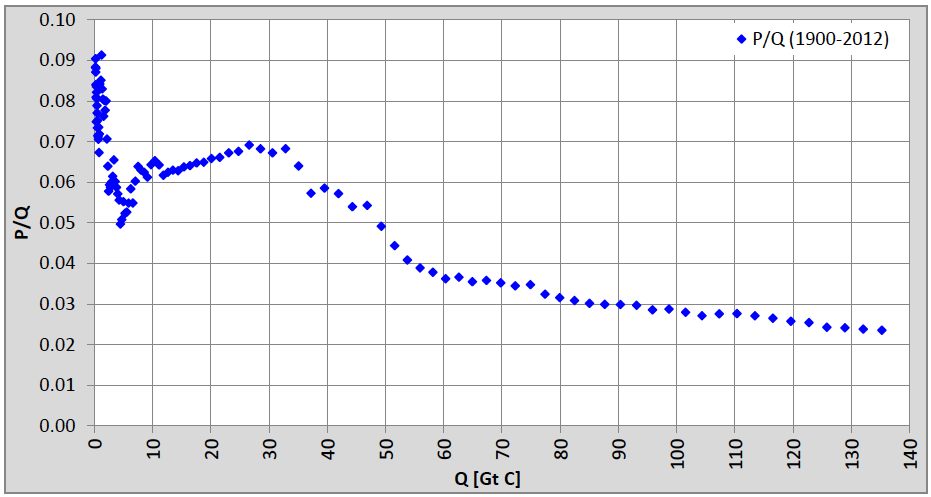
Below a value of 0.04, you can see the dots lining up in a roughly linear way. When you move the cursor over the first dot just below the 0.04 line, an information box shows the coordinates of this dot: “Series “P/Q (1900-2012)” Point “55,931” (55,931, 0.0389)” Looking up these data in the table and you will find that they belong to the year 1983. So, as from 1983, the carbon emission data from liquid fossil fuels start to line up in a linear way.
Before we can let Excel calculate a linear trend line, we first have to make a second graph of the 1983-2012 data. Do this in exactly the same way as the former graph, but only select the 1983-2012 data. Your graph should now look like this:
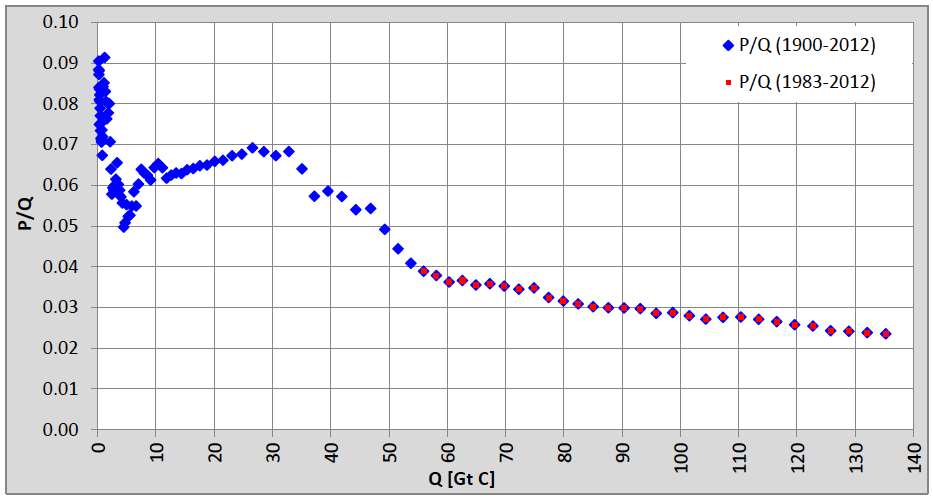
Of this second graph (of red dots) we let Excel calculate a linear trend line. You could calculate it yourself (the WikiPedia page “Linear Regression” will tell you all you need to know), but it’s very tiresome work and too farfetched for this article.
From the “Chart Tools” select the menu tab “Layout”, click the “Trendline” button, select “More Trendline Options” and select the “P/Q (1983-2012)” series. In the “Format Trendline” dialogue box, select the “Linear” type of trend line. At the bottom, tick the selection box “Display Equation on Chart” and close the dialogue box. You now see the linear trend line as a thin black line in your graph, together with its mathematical equation.
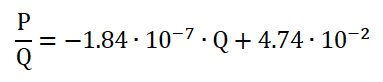
To improve the precision of this equation, right-click on it and from the quick menu that pops up, select “Format Trendline Label”. Now format the numbers of the formula as “Scientific” with two decimals (more decimals will only give a false impression of high accuracy). In this case scientific numbers come in quite handy because the P/Q-numbers are very small and the Q-numbers very large (so, don’t bother about them and let Excel do the job). Brightening up your chart a bit, your graph should now look like this:

Now we have the values for “a” (-1.84·10-7) and “b” (4.74·10-2) and we can convert the mathematical trend line formula into our carbon emissions formula by changing “y” into “P/Q” and “x” into “Q”:
Annual emission data follow by multiplying both sides of the equation with “Q”:

We can now calculate the ultimate amount of carbon emissions from liquid fossil fuels at the end of the age of oil (Qt). This is when P = 0:

So let’s solve this equation:

Calculating Hubbert’s Curve
Now we can calculate Hubbert’s curve of CDIAC’s carbon emissions from liquid fossil fuels. First we not only want to calculate our Hubbert’s curve up to 2012, but through the end of this century, so we have to extend column A to 2100. The quickest way is to enter the Excel formula “=A264+1” in cell A265 and copy this formula down to the cells A266 till A352.
To the right of column F (with the P/Q data) we insert two new columns G and H. Merge cells G1 and H1 and type something like “Hubbert Oil”. Something similar you can do with cells D1, E1 and F1, naming them Historic Oil. In cell G2, write “P [Mt C]” and in cell H2 “Q [Mt C]”. Your table (as from 1870) should now look like this:

We need to put the values of “b” and “Qt” somewhere in the sheet. I put them in the following cells:
- Cell M265: “b [P/Q]”
- Cell M266: “4.74E-02” or “0.0474” (same value, different formats)
- Cell M267: “Qt [Mt C]”
- Cell M268: “258,000”
- Cell M269: “Q-1870 [Mt C]”
- Cell M270: “1” (for the time being, later you will see why)
In cell H122 enter “=M270” (To check, this is Hubbert’s cumulative emissions in the year 1870). Since the calculation of cumulative emissions remains the same, copy cell E123 to the cells H123 till H352.
We have to be careful now, because we’re going to use Q to calculate P and P to calculate Q, which results in a circular reference. However, given the right settings, Excel can easily deal with that. Click the Office button in the top-left corner of Excel and click the “Excel Options” button (bottom-right). Now click the “Formulas” button (top-left) and activate “Enable iterative calculation” (top-right). Usually it’s not necessary to tinker with the maximum amount of iterations and change. Leave the Excel Options by clicking “OK”.
Now we’re going to use the formula we arrived at on page 4 (repeated here, for convenience):
 In Excel-format, enter in cell G122:

The dollar-signs mean that the row-numbers of these cells don’t change when the formula is copied. This is necessary, because M266 and M268 are the two numbers “b” and “Qt”, which occupy one fixed cell. Copy cell G122 down to the cells G123 till G352. Your table should now look like this:
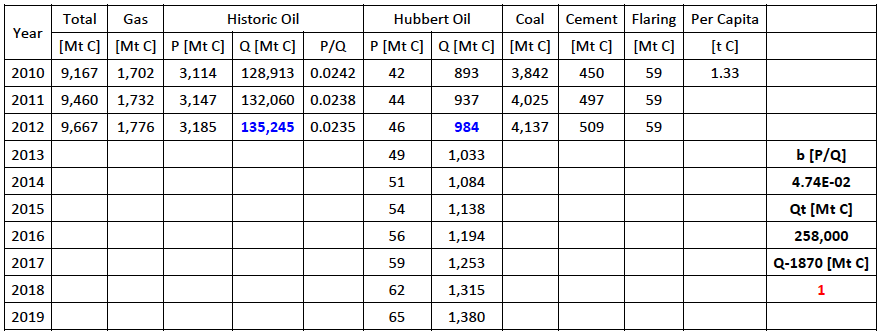
You can see I gave the cells E264 and H264 a bold and blue format to let them stick out. Likewise I made cell M270 bold and red. It’s handy to do the same.
Matching Hubbert’s Curve with Historical Data
So what do we have now? We have a Hubbert’s curve (for sure, if you copy it down another century), but it’s not yet matched with the calendar years of historic emission data. To imagine what needs to be done, we need to move our Hubbert’s curve horizontally across the chart, until it best fits with the historical data. The most acurate way to do this is to adjust the initial value of cumulative emissions in 1870 (we set it to “1”, for time being) such that Hubbert’s cumulative emissions in 2012 equal the historical cumulative emissions of that same year (that’s why I marked them blue and bold for comparison).
Now finding this match is a matter of changing the value “1” of cell M270 and seeing what happens. To avoid having to scroll up and down between 1870 and 2012, I placed this adjustment cell at M270, while H122 uses M270 as its starting value (now you see why).
So, give it a try and change cell M270 from 1 to 10. You should now see that the blue cell H264 has increased from 984 to 9,498. So, we’re heading in the right direction, but we’re not there yet. Try 100 instead of 10. H264 has now increased to 70,639. It seems we’re half way now, so let’s try 200. H264 is now 110,198, so we’re getting there. Say, 250? H264 = 124,157. M270 = 300? H264 = 135,637. That’s just a tad too much! M270 = 299? H264 = 135,427. Still a tiny bit too much. M270 = 298? H264 = 135,217. For the record: M270 = 297? H264 = 135,006. So, 298 is a much closer match than 297: M270 = H122 = 298! We have matched Hubbert’s curve horizontally with the historical emission data.
Now, curious in which year Hubbert’s peak occurs? Look at the annual emissions of Hubbert’s curve in column G. In which year does it reach its highest value? In 2010!
Combining Hubbert’s Curve and Historical Data in a Graph
From the tab menu “Insert”, select a 2-D line graph. From the Chart Tools select the menu tab “Design”, click the button “Select Data” and click the button “Add” (under “Legend Entries (Series)”). In the dialogue box that opens up, enter as a “Series Name” something like “Hubbert’s Curve (1870-2100)”. Select the data cells G122 till G352. You can now see you have added a legend entry, but you still have to edit the “Horizontal (Category) Axis Labels”. So, click on the “Edit” button and select the cells A122 till A352.
Now add a second data series of the historic annual emissions of cells D122 till D264 (Chart Tools -> Design -> Select Data). However, select as its calendar series the same range of years as the Hubbert’s curve (1870-2100): cells A122 till A352. After tidying up a bit, your chart should look like this:

Conclusions
Based on CDIAC’s global data of carbon emissions from liquid fossil fuels (i.e. predominantly petroleum) and Marion King Hubbert’s method of calculating the oil production curve, we have arrived at a theoretical emissions peak of carbon from liquid fossil fuels (i.e. oil production peak) in 2010.
Compared to earlier forecasts of oil-geologists and other experts using Hubbert’s methodology, the calculations based on CDIAC data get quite close to the mark. Most of these experts (like Collin Campbell, Jean Laherrère, Kenneth Deffeyes and Matthew Simmons) forecast peak-oil between 2005 and 2010, so the CDIAC data turn out to be a fairly reliable source for this purpose.
Theoretically, we’re already 4 years past the peak, although historical data still show growth. This is very well possible for a limited period of time. Given the frantic drilling and fracking spree we’ve seen since about 2007, it’s not even surprising. Extraction methods have improved as well over the last decade or so: horizontal drilling, hydraulic fracturing, deep-sea drilling, more accurate 3D soundings of geological formations, etc. The much higher oil price has also made it worthwhile to drill for harder-to-get oil. So, the ultimately recoverable amount of oil has increased indeed (though I don’t know by how much) and this is not (yet) reflected in the historical data.
Recent Developments
Since a few years, there has been a lot of talk that there are so much fossil fuel reserves left that we can only responsibly burn about one third of them (leaving two-thirds in the ground) in order to keep global warming below 2°C (IEA, 2012). This also implies that the shares of fossil fuel companies are over-valued by up to 80% (Carbon Tracker, 2012; Carbon Tracker, 2013). However, there are several caveats against this analysis:
- The reserves are based on stated reserves of fossil fuel companies and governments, but we don’t know to what extent these reserves are overstated. Of the OPEC-countries it’s quite obvious that (for political motives) they overstated their reserves dramatically between 1987 and 1990. The sudden jumps in stated reserves were not accompanied by announcements of newfound oil fields. Also, it doesn’t add up that oil reserves have remained virtually constant during decades of high rates of oil production and low rates of new discoveries:

Source: own compilation of U.S. Energy Information Administration data
(EIA, 2013) - It’s not the amount of fossil fuel reserves that counts; it’s the rate at which they can be extracted. The big oilfields with high quality and easy to get petroleum are mostly depleted. We are now looking for ever smaller fields in ever harder to reach locations, like the ocean floors and the arctic. When it’s ever harder to get the oil, this will result in a slowdown of the rate of extraction (i.e. going down the other side of Hubbert’s curve).
- The Energy Return on Energy Invested (EROEI) has already gone down seriously. The EROEI is an analysis of how much energy it takes to produce fossil energy (produce materials and operate machinery needed to construct the facilities to drill for oil and get it to the market, like drilling rigs, pipelines, oil tankers, refineries, etc.) and how much energy you get from all this. The EROEI used to be 100:1 in the 1930s – 1950s. Talking about tar sands the EROEI is already down to something like 5:1. This means that for every 5 barrels of oil (equivalent) one has to be invested into getting it, 4 are left as “profit”. Once it takes one barrel of oil to get one barrel of oil, there won’t be any profit left and it’s pointless to continue. Actually well before this point (say 2:1) because an oil company needs to sell at least some oil to pay for the investments in wages and equipment.
- The cost of oil extraction is already such that the oil price has to be above $100/barrel in order to be profitable. On the other hand, how high a fossil fuel price can the world economy afford in order to function healthily? We’ve seen the world economy crash into the Great Recession in 2008, when the oil price soared to $147/barrel (I daresay it wasn’t exactly a housing bubble…) and the price is again hovering around $100/barrel. No wonder economic growth doesn’t want to pick up! Oil consumption simply responds to the economic law of supply and demand. When oil gets too expensive, people will turn to cheaper alternatives and oil consumption goes down (the other side of Hubbert’s curve) just the same.

So there are many ways to look at peak-oil (environmental, geological, economical, social, etc.). One way doesn’t exclude the other, so I surely don’t want to contribute to infighting between peak-oilists and environmentalists. Both are right and allies to the same cause: we have to think hard and take swift action to create a sustainable way of living in harmony with the world wide web of life on our planet, in order to prove that human intelligence was not an evolutionary error.
Bibliography
Campbell, Colin J., and Jean H. Laherrère. “The End of Cheap Oil.” Scientific American 278.3 (1998): 78-83. Print. Download at http://josiah.berkeley.edu/2007Fall/ER200N/Readings/Campbell_1998.pdf
“Carbon Dioxide Information Analysis Center.” (CDIAC). Web. 24 Apr. 2014. Website http://cdiac.ornl.gov/
Global Fossil-Fuel CO2 Emissions. CDIAC. Web. 24 Apr. 2014. Website http://cdiac.ornl.gov/trends/emis/tre_glob_2010.html
The Crisis of Civilization. Dr. Nafeez Mosaddeq Ahmed. Dead Dean Films, 2011. Film. Watch at http://www.youtube.com/watch?v=pMgOTQ7D_lk
A Crude Awakening. Dir. Basil Gelpke and Ray McCormack. 2006. Film. Watch at http://www.youtube.com/watch?v=7qGM9ypR-UI
Crude Impact. Dir. Jennifer Jandak Wood, James Jandak Wood, and Joanne Shen. 2006. Film. Watch at http://www.youtube.com/watch?v=bvyDH8-y-AE
Deffeyes, Kenneth S. Beyond Oil: The View from Hubbert’s Peak. New York: Hill and Wang, 2005. Print.
Hubbert, M. King. Nuclear Energy and the Fossil Fuels. Houston: Shell Development, Exploration and Production Research Division, 1956. Print. Download at http://www.hubbertpeak.com/hubbert/1956/1956.pdf
International Energy Statistics. EIA, 2013. Data. Download at http://www.eia.gov/cfapps/ipdbproject/iedindex3.cfm?tid=5&pid=57&aid=6&cid=CG9,&syid=1980&eyid=2013&unit=BB
Unburnable Carbon – Are the World’s Financial Markets Carrying a Carbon Bubble? Rep. Carbon Tracker. 2011. Print. Download at http://www.carbontracker.org/wp-content/uploads/downloads/2011/07/Unburnable-Carbon-Full-rev2.pdf
Unburnable Carbon 2013: Wasted Capital and Stranded Assets. Rep. Carbon Tracker. Print. Download at http://carbontracker.live.kiln.it/Unburnable-Carbon-2-Web-Version.pdf
World Energy Outlook 2010, Executive Summary. IEA, 2010. Print. Download at http://www.iea.org/textbase/npsum/weo2010sum.pdf
World Energy Outlook 2012, Executive Summary. IEA, 2012. Print. Download at http://www.iea.org/textbase/npsum/weo2012sum.pdf

Hans,
I went ahead and published your work now so people would have a chance to read it and form questions, especially those wanting to try and reproduce your results. I have never heard of anyone using the CO2 emissions of fossil fuels to calculate the peak and decline of the age of oil, but it appears to work quite accurately. I remember Tim Garrett saying you could simply take CO2 measurements at the top of Mauna Loa in order to calculate to a high degree of accuracy the size of the global economy. So we are now riding the crest of Hubbert’s Peak with the unconventional liquid fuels.
LikeLike
Thank you both for this.
I was talking with a friend today about the many issues we discuss here, and the culture of complacency which is reinforced by vague statements such as: “My brother-in-law works on the rigs and he says there is plenty of oil.”
I did point out that to many people 1 billion barrels oil sounds like a humungous quantity; until you understand that the world economy uses around 31 billion barrels a year, and that an individual reserve of 1 billion barrels would keep the world supplied for about 2 weeks (if it were possible to suck it dry that quickly).
There are many issues with the Hubbert curve itself, in particular the matter of internationally tradable oil. As many know, most of the nations with oil reserves peaked in extraction some time ago and are experiencing steep declines in extraction. What is more, many of the nations that still do extract more than they use are experiencing rapid increases in domestic consumption which will lead to a severe shortage in oil on the international market fairly soon. It has only been demand destruction, as economies slowly implode, that has allowed the globalised economic system to stagger on. Well, that, together with fracking, frantic money-printing by central banks and ZIRP.
Those of us involved in the peak oil movement here in NZ remember the blithe assurances (incompetence? lies?) from government ministers ‘Dopey Pete’ and ‘Daffy Duck’ that peak oil would not occur until 2067, which was later revised to 2031.
I have not bothered to write to governments in recent years but my understanding of the Key government’s stance is that there is no such thing as peak oil and therefore there is no need to have any policy relating to it. By the same token, ‘climate change is a myth’, a stance which is sometimes revised to ‘climate change will be beneficial to NZ’; NZ therefore does not need to consider it in any of the planning processes, other than to sit back and wait for the ‘benefits’ to arrive (the main highway north from Napier being about half a metre above current high tide and the motorway that links Auckland and Northland of the rest of the North island being a similar height above current high tide. We won’t mention Christchurch, already susceptible to significant flooding.)
Road building is in full swing around the country, along with upgrades to airports.
LikeLike
HA-HA, Kevin – that’s just great! Like one of the Carolina’s BANNING any speech about or consideration of climate change, or Canada’s policy of making scientists ask for permission to publish their findings (especially if they go against government policy). These loons are our supposed LEADERS! They’re leading us down the primrose path to perdition. The joke is on us unfortunately. They’re still building houses around here (that relatively no one has bought for at least 3 years now, since all the well-paying jobs have fled the country).
xraymike and Hans – great work and thank you!
My first question is why we’re using a line to model the data and not a quadratic (as in an inverted parabola) or exponential function (for either the growth half or the decay part)?
That is truly amazing that one can parse out Peak Oil from CO2 emissions – great job!
How did you come up with that idea, Hans?
One of the results of climate change (brought to us by the fossil fuel industry and the infinite growth paradigm):
http://www.desdemonadespair.net/2014/04/drought-worsens-in-western-us-all-of.html
Drought worsens in western U.S. – All of California now in drought, cost estimated to be at least $7.48 billion
Drought spread and intensified this week in seven western and central states, including California, Oregon, Nevada, Arizona, New Mexico, Texas and Oklahoma, according to the U.S. Drought Monitor, a federal site that tracks drought.
This week marks the first time in the 15-year history of the Drought Monitor that 100% of California was in moderate to exceptional drought.
The cost of the drought in California is estimated at least $7.48 billion in direct and indirect costs, according to Mike Wade, executive director of the California Farm Water Coalition. This includes crop losses and about 20,000 job losses tied to 800,000 acres of idled farmland.
The amount of acres idled equals the size of Los Angeles, San Diego, San Jose, Fresno and Bakersfield combined — some 1,250 square miles.
Crops such as iceberg lettuce, broccoli, bell pepper, cantaloupe and tomato are being hardest hit, the farm coalition reports.
“If you combine the current drought with the nearly $450 million in damage to the state’s citrus crop from a freeze last December, the state’s agriculture has really had a rough couple of months,” says Steve Bowen, a meteorologist with Aon Benfield, a global reinsurance firm based in London.
“If the intensity of the drought remains prolonged, the economic cost will surely continue to grow,” he says.
The worst of the drought in California is centered in the west-central part of the state.
The city of Montague, in Northern California, risks running out of drinking water by the end of summer and has requested that all outside watering be reduced until further notice, according to the Monitor. This is the first time in over 80 years that this has occurred.
More than 60% of the West is in some form of drought. Only Montana and Wyoming are completely drought-free. [more]
If Mother Nature was a boxer – hitting a state (and the country) in the “bread-basket” produces immediate results and gets people’s attention. If we’re too stupid or brain dead to react properly, we’ll get decked.
LikeLike
First, your first question. The function “f(Q/P)=Q” appears to BE a linear function. So in order to adapt to this apparent reality one should model it as such: a linear trend line.
Only after multiplying both sides of the equation with “Q”, does a quadratic function appear (Hubbert’s curve), but a quadratic function is too complicated to be convincing.
It’s just like Kenneth Deffeyes said (in terms of clarity and persuasiveness): “… nothing beats a straight line on a graph.”
LikeLike
Separately your second question of how I got the idea (to use CDIAC data to calculate peak-oil).
When my wife started to work for the Bolivian mission to the UN in New York (february 2009), I made myself useful by giving an introductory course on climate change to the Bolivian Mission’s staff (most did not understand much of the scientific concepts of the IPCC’s AR4 report).
I can’t remember how I came across CDIAC for the first time, but after this climate change course I gratefully used the data to calculate historic and per-capita emission curves of rich, former Warsaw Pact and poor countries (in UNFCCC terms: annex I, annex II and non-annex countries) to give the Bolivian and other ALBA missions some ammunition in the run-up to the disastrous Copenhagen Climate Summit of December 2009.
After this I started studying issues like (in short) “Peak Everything” (Richard Heinberg), population growth, concepts of overshoot and collapse, “The Limits to Growth” (Club of Rome, 1972). I must say it was (and still is) a traumatic but purifying cure to become aware of the downsides of capitalism and what the future has in store for humanity.
When I read Kenneth Deffeyes’ book “Beyond Oil” and its mathematical explanations, I felt very tempted to do this math myself. At that moment I remembered CDIAC’s data and realized they should be a good proxy. They turned out to be even better than expected.
LikeLike
Oh, and to your last statement about reacting to create a “sustainable” way of living in harmony with the world – this has been shown to be a myth. There is no such thing as sustainability after we’ve long since passed population overshoot and triggered nearly three dozen self-reinforcing feed-backs that will only continue to make matters worse in the coming years. The so-called “genie” is out of the bottle and there’s no putting it back now. Other than that – great analysis!
LikeLike
“There is no such thing as sustainability after we’ve long since passed population overshoot […]”
True enough! Humanity will, inevitably by now, experience an unprecedented traumatic 21st century. If the worst comes to the worst (continue with business as usual at all cost for as long as we can), I expect the collapse to be such that by the end of this century we will look back upon WW-II like a pleasant pick-nick.
However, if we do not continue business as usual at all cost and ever more people change their way of life toward sustainable forms, it may still be possible to eke out a decent way to live. It will be much more local, manual, physically hard labor, but that has its benefits as well: bye bye obesity and related diseases, you don’t need to waste time jogging to keep healthy and fit, it offers work for many more people nowadays unemployed, it’s a proud job to make something yourself with your own hands and hand tools (I’ve made most of my furniture myself, they will last a lifetime and I’m proud of them).
Surely some billions of humans will have disappeared by 2100, but the collapse may be stretched out (relatively more benignly) over a longer time-span and after the collapse of industrial civilization some civilization may be able to survive in some places (I think Bolivia is not a bad bet).
Mind you, western industrial civilization is not the only possible civilization and surely not the kind of civilization that makes people feel happiest.
As the saying goes: hope is the last thing to die. If it does, one might as well jump from a bridge. But I believe it’s still possible to avoid the worst case scenarios and save something of our planet and human civilization. In any case, we have no other option than to try (or, as I said, have the courage to jump from a bridge).
LikeLike
Nice work Hans. Thank you.
LikeLike
More from Desdemona Despair this morning on climate change and its effects:
http://www.desdemonadespair.net/2014/04/naomi-klein-climate-change-is-fight-of.html
Naomi Klein: Climate change is the fight of our lives, yet we can hardly bear to look at it
This is a story about bad timing.
One of the most disturbing ways that climate change is already playing out is through what ecologists call “mismatch” or “mistiming.” This is the process whereby warming causes animals to fall out of step with a critical food source, particularly at breeding times, when a failure to find enough food can lead to rapid population losses.
The migration patterns of many songbird species, for instance, have evolved over millennia so that eggs hatch precisely when food sources such as caterpillars are at their most abundant, providing parents with ample nourishment for their hungry young. But because spring now often arrives early, the caterpillars are hatching earlier too, which means that in some areas they are less plentiful when the chicks hatch, with a number of possible long-term impacts on survival.
Similarly, in West Greenland, caribou are arriving at their calving grounds only to find themselves out of sync with the forage plants they have relied on for thousands of years, now growing earlier thanks to rising temperatures. That is leaving female caribou with less energy for lactation, reproduction and feeding their young, a mismatch that has been linked to sharp decreases in calf births and survival rates.
Scientists are studying cases of climate-related mistiming among dozens of species, from Arctic terns to pied flycatchers. But there is one important species they are missing – us. Homo sapiens. We too are suffering from a terrible case of climate-related mistiming, albeit in a cultural-historical, rather than a biological, sense. Our problem is that the climate crisis hatched in our laps at a moment in history when political and social conditions were uniquely hostile to a problem of this nature and magnitude – that moment being the tail end of the go-go ‘80s, the blast-off point for the crusade to spread deregulated capitalism around the world. Climate change is a collective problem demanding collective action the likes of which humanity has never actually accomplished. Yet it entered mainstream consciousness in the midst of an ideological war being waged on the very idea of the collective sphere.
This deeply unfortunate mistiming has created all sorts of barriers to our ability to respond effectively to this crisis. It has meant that corporate power was ascendant at the very moment when we needed to exert unprecedented controls over corporate behaviour in order to protect life on Earth. It has meant that regulation was a dirty word just when we needed those powers most. It has meant that we are ruled by a class of politicians who know only how to dismantle and starve public institutions just when they most need to be fortified and reimagined. And it has meant that we are saddled with an apparatus of “free trade” deals that tie the hands of policymakers just when they need maximum flexibility to achieve a massive energy transition.
Confronting these various structural barriers to the next economy is the critical work of any serious climate movement. But it’s not the only task at hand. We also have to confront how the mismatch between climate change and market domination has created barriers within our very selves, making it harder to look at this most pressing of humanitarian crises with anything more than furtive, terrified glances. Because of the way our daily lives have been altered by both market and technological triumphalism, we lack many of the observational tools necessary to convince ourselves that climate change is real – let alone the confidence to believe that a different way of living is possible.
And little wonder: just when we needed to gather, our public sphere was disintegrating; just when we needed to consume less, consumerism took over virtually every aspect of our lives; just when we needed to slow down and notice, we sped up; and just when we needed longer time horizons, we were able to see only the immediate present.
This is our climate change mismatch, and it affects not just our species but potentially every other species on the planet as well. [more]
LikeLike
Klein’s piece has been posted ad nauseum this week…she has a new book due in September so we’ll be seeing a lot of her.
Here’s an epic takedown of her “epic self delusion” that Dave Cohen posted on Thurs…I have partially quoted to include what (I think) may touch upon the subject of Mike’s upcoming post::
“Humans generally, and activists in particular, necessarily cling to the delusion that humans control own their destiny, no questions asked. You know, Free Will and all that. But of course that is the central delusion governing the Flatland brain—that our tiny, hapless “awareness” or “ego” is running the show, and there is no vast, underlying unconscious sea driving our behavior, both in individuals and populations. All of our self-created problems are chalked up to “cultural” (not instinctual) behaviors which are easily amenable to change. Thus Klein writes this, repeated from above—
If the ideas that rule our culture are stopping us from saving ourselves, then it is within our power to change those ideas…
I don’t agree with everything psychologist Jonathan Haidt says, but he got it right when he said—
The worst idea in all of psychology is the idea that the mind is a blank slate at birth.
Klein’s fantasy, which is the most generalized human fantasy, is that all human behavior is culturally driven. In so far as human cultures are merely arbitrary products of the human mind—the mind is a blank slate upon which arbitrary cultural “norms” get written—it is thus possible to change human cultures in arbitrary ways, and in so doing, change human minds as a result.
Got a problem? Simply change the culture, and voila! — problem solved!
This is not only the “worst idea” in all of psychology; it is the most delusional idea humans have. Tragically, that delusion is necessarily a product of the Flatland brain.
Now let me go off on a related tangent.
Humans have known they are changing the Earth’s climate for many years now. The ball got rolling when Jim Hansen testified to that effect before the United States Senate in 1988. Nearly all real uncertainty had been vanquished by the early 2000s. And when I say ‘humans’ in that first sentence, I mean important, elite humans. Climate “deniers” are not important, although in some instances they are among the human elite.
There is hardly a financial bigwig or big cheese politician on Earth who doesn’t fully understand that human activity is changing our once benign Holocene climate into something which threatens our very existence. As Leonard Cohen said, everybody knows (video below).
Whether that certain knowledge is fully conscious or buried somewhere in the unconscious matters not at all, which was Leonard Cohen’s point.
The Naomi Kleins of this world like to focus on the Koch Brothers or whoever is running Exxon Mobil. They like to blame these people for human inaction on the climate. Even those people know that humans are changing the climate, despite what they might say publicly. But they also know with great certainty that mitigating climate change is bad for business, so they have sown seeds of doubt in the public mind, helped along by the corporate-owned, compliant and worthless mainstream media in the United States.”
http://www.declineoftheempire.com/2014/04/self-delusion-is-not-a-substitute-for-actual-thought.html
My own favorite quote…”The main event is taking place in the human unconscious. The important stuff is going on outside of awareness. You can pretty much forget about almost everything you hear humans say about global warming. So much of it is incoherent nonsense.”
Dave includes this nice video of Cohen’s great song…
LikeLike
Robert Scribbler has a piece on this too!
Renewable Energy and The Fierce Urgency of Now: A Second Call For Fossil Fuel Abolition
“We have also come to this hallowed spot to remind America of the fierce urgency of Now.”
Though these words were spoken in the noble pursuit of the most just of causes by Dr. Martin Luther King many years ago, they have lost none of their potency or relevance. For though those facing economic and social oppression have been justly elevated by the actions of the equality movement Dr. King so eloquently spoke for, we are now in the process of consigning ourselves and our progeny to an entirely different but no less brutal kind of oppression. A world where danger, difficulty, severe environmental hazard and poverty will come as a result of our failure to make the right energy decisions now.
It is a brutal kind of generational theft in which the current wealth of some is dependent on the enslavement of our own children to the spite of a barren and violent world. A world that could best be seen as a curse. A world of rising seas, expanding deserts, of scarce water, of ruined and abandoned cities, a world where the oceans themselves vent poison gas.
That we could set ourselves on such a path requires the very worst kind of social blindness. A zombie state of denial in which we have willfully hidden our faces from the ever-more-visible harm we are causing. For we must be in such a state to even consider the continued use of the dirty and harmful fuels. For we must be lost if we do not understand the pain we will surely inflict on future generations and even ourselves as we inflame our world to conditions not seen in 10 million, 55 million, or 250 million years. As we, with each lighting of a fossil fire, invoke the names of past great extinctions: Eocene, Jurrassic, Permian.
(Mass Extinction Events. Two of the three major mass extinctions and many more of the minor mass extinctions over the past 250 million years have been linked to greenhouse gas driven hothouse and Stratified/Canfield Ocean events. Image source: Biodiversity Crisis.)
There is no excuse for keeping on this path. No justification for the harm that would surely come from our continued burning. No rationale that could lend credence to ensuring our world becomes a place of Great Dying.
On March 22, 2013, a call was made for Fossil Fuel Abolition. Only a few have listened. Some, like the nation of Scotland, have pledged to pursue a true construction of that enlightened ‘City on a Hill,’ by harnessing the glorious blaze of solar radiance or the whispering winds of our world.
So I ask, why not America? Is Scottland to boldly lead in the turning away from the path of harm? Is it for America to come up with a vile excuse not to follow? To delay and to therefore cause more harm?
Some among us have turned their face from environmental oppression and asked others to follow. James Hansen, Rachel Carson, Bill McKibben, Joe Romm, Chris Hayes and ever so many more. Yet others dissemble, making false claims, providing rationales for escalating violence. So, in this most desperate hour, we are a house divided. Divided into those who serve a future in which humankind can rationally live and those who serve the Destroyers of the Earth.
This is an unconscionable state and it cannot stand. So the call must again go out.
LikeLike
http://robinwestenra.blogspot.co.nz/2014/04/good-and-evil.html
Good and Evil
An old Cherokee told his grandson:
“My son, there’s a battle between two wolves inside us all.
One is EVIL.
It’s anger, jealousy, greed, resentment, inferiority, lies and ego.
The other is GOOD.
It’s joy, peace, love, hope, humility, kindness and truth.”
The boy thought about it and asked:
“Grandfather, which one wins?”
The old man quietly replied: “The one you feed.”
[author unknown]
LikeLike
That’s a good one.
A Quote by Cherokee Indian on jobs, spirit, time, water, and work…
The Oklahoma Farmer-Stockman recently published two pictures, one of a dilapidated house and the other of a washed-away field. The magazine offered a prize for the best essay on the two pictures. The first prize was won by a Cherokee Indian, who wrote this:
Both pictures show that white man crazy. Make big teepee, plow hill, water wash down, windblown soil, grass all gone. Squaw gone, papoose too. No chuckaway. No pigs, no corn, no hay, no cow, no pony. Indian no plow land, keep grass, buffalo eat. Indian eat buffalo. Hide make teepee, moccasins too. Indian no make terrace, no build dam, no give a dam. All time eat, no hunt job, no hitch-hike, no ask relief, no shoot pig, Great spirit make grass, Indian no waste anything. Indian no work. White man heap crazy.
Cherokee Indian
LikeLike
A Cherokee may have said that a century ago, I assure you they don’t talk that way now.
http://www.cherokee.org/
I am acquainted with a few, they are still fighting the good fight, only know it’s much more intellectual
.http://www.cherokee.org/LearningCenter/
LikeLike
I work mostly with the Navajo and I’m here to report, sadly, that they are as integrated into the fossil-fueled consumer culture of American capitalism as all the rest of us.
LikeLike
to the point of the comment, tipi’s make an excellent portable home, warm in winter, cool in summer. the Chickasaws construct a wattle and daub structure which is fired before the thatched roof is applied, sturdy and comfy.
the obvious way to build to conserve is underground.
http://en.wikipedia.org/wiki/Dugout_(shelter)
earth bermed or full underground would save so much energy it’s sick, but it’s expensive and most people don’t have the money.
LikeLike
It’s not that expensive. This guy is building some.
http://www.richsoil.com/wofati.jsp
LikeLike
I misread that last line as “The one you feel,” which works, too. Considering how motivation springs more from emotion than intellect, fear as a driver of action has a greater influence over behavior than informed analysis.
LikeLike
Fear seems also to drive inaction (yes, a form of action) as apathy, silent denial, retreat from response and responsibility.
LikeLike
I thought the same when I read the comment.
I would go as far as saying that fear is now the main driver of inaction when it comes to our mayor and council officers; fear that attempting to change the insane culture will stir the wrath of the corporations and opportunists who control practically everything, and fear of a backlash from the ignorant masses who have been trained to defend the culture of entitlement.
Thus, the easy way out,[in the short term] of doing next to nothing to challenge BAU continues to be the preferred strategy for those in power, perhaps accompanied by a bit of’ praying to the gods’, a strategy which failed dismally for those who chose to remain in Pompeii after the first rumblings of Vesuvius led to the famous eruption of AD 79.
http://en.wikipedia.org/wiki/Pompeii
AD 62–79
Main article: Mount Vesuvius Precursors and foreshocks
The inhabitants of Pompeii had long been used to minor quaking (indeed, the writer Pliny the Younger wrote that earth tremors “were not particularly alarming because they are frequent in Campania”), but on 5 February 62,[9] there was a severe earthquake which did considerable damage around the bay and particularly to Pompeii. It is believed that the earthquake would have registered between about 5 and 6 on the current Richter scale.[10]
On that day in Pompeii there were to be two sacrifices, as it was the anniversary of Augustus being named “Father of the Nation” and also a feast day to honour the guardian spirits of the city. Chaos followed the earthquake. Fires, caused by oil lamps that had fallen during the quake, added to the panic. Nearby cities of Herculaneum and Nuceria were also affected.[10]
Temples, houses, bridges, and roads were destroyed. It is believed that almost all buildings in the city of Pompeii were affected. In the days after the earthquake, anarchy ruled the city, where theft and starvation plagued the survivors. In the time between 62 and the eruption in 79, some rebuilding was done, but some of the damage had still not been repaired at the time of the eruption.[10] Although it is unknown how many, a considerable number of inhabitants moved to other cities within the Roman Empire while others remained and rebuilt.
An important field of current research concerns structures that were being restored at the time of the eruption (presumably damaged during the earthquake of 62). Some of the older, damaged, paintings could have been covered with newer ones, and modern instruments are being used to catch a glimpse of the long hidden frescoes. The probable reason why these structures were still being repaired around seventeen years after the earthquake was the increasing frequency of smaller quakes that led up to the eruption
,
LikeLike
Steve Cutts – The Last Handshake
“Here’s a piece I’ve been working on and off during the late nights for a couple of weeks now, a visualization what I imagine Man’s final handshake could be. I started by hand drawing the various elements before scanning them in and arranging and adding colour elements in Photoshop. It’s now been through a heap of changes since its initial incarnation- originally it was to be a quick small black and white portrait format piece, with just the figures and the landfill hill with a plain coloured backdrop. Then I started organically adding elements – smoke twists, a few hills etc, and it kept increasing the frame/zooming out until eventually it just evolved into more of a sprawling landscape piece. It’s been through a load of colour changes too, monochrome initially, to gloomy sepia, to the usual apocolyptic fiery red and then the nuclear green hue it is now.
Let’s just hope it doesn’t actually happen. Enjoy!”
LikeLike
That’s a terrific piece! From artist to artist – Only tiny suggestion: put a kink in the pole holding the STOP sign. The system is broken.
LikeLike
LikeLike
This essay was linked at Peakoil.com under ‘Peak Oil Discussions’ here:
http://peakoil.com/forums/peak-oil-discussion-f1.html
The actual posting is here:
http://peakoil.com/forums/using-global-co2-emissions-data-to-calculate-hubbert-s-curve-t69612.html
LikeLike
I posted a reply to Kevin on the previous thread after this thread started. As probably most readers would have missed it, I thought I would mention here that for any readers with an interest in the crucial role played by energy in industrial society, and in particular the misunderstanding and underestimation of it’s importance by neoclassical economics, I highly recommend the book ‘Energy and the wealth of nations’ by Hall and Klitgaard. Some readers would be able to skim read some sections that cover fairly basic science, but the format is quite accessible. I found it very interesting, but unfortunately I think it is too late to make the needed changes. The population is an order of magnitude too large, the juggernaut of industrial civilisation is unstoppable, climate disruption effects will be becoming horrendous, all governments around the world are advised by economists with an incorrect understanding of the biophysics of the earth, as this book explains, a large percentage of the population is clueless or uninterested,etc. A quick note for anyone who decides to read the book and who hasn’t done chemistry. There are two incorrect chemical equations in the book. One is on page 228 ,and one is on page 238. Hopefully theey will correct them in the next edition. Don’t let that discourage you from reading the book, it is just a minor point. Thank you posting this essay, Mike , and compliments to Hans.
LikeLike
What economists understand or don’t understand is irrelevant. They are there to legitimize the 1% and BAU. They are the equivalent of priests preaching the divine right of kings and the superiority of royal blood lines. Noe-liberal economics are a creation of the 1%. The old economic priests were not serving their needs, so like Henry VIII, they swapped them out for more agreeable ones.
LikeLike
Just took a peek at the daily headlines and yes, you are correct. BAU all the way into extinction. Remember this essay:
LikeLike
Ex- Australian prime minister Malcolm Frazer has ruffled a few feathers by suggesting that Australia has aligned itself too closely with the US, and in the looming showdown between the US and China will find itself ‘up the creek without a paddle’.
NZ is in a similar position, though in not quite as deep a hole as Australia because NZ is not engaged in digging up the landscape and exporting it to China as quickly as possible, not quite sacrificing everything for the sake of a few dollars more the way Australia is (the NZ government just allows massive sell-offs of land and infrastructure to overseas interests in order to maintain some semblance of BUA).
.
,
LikeLike
So that readers can see what you are referring to without having to leave this page (and fixing a few minor typos etc.):
You [dairymandave] obviously do not understand EROEI. Indeed, I wonder whether you even understand energy at all.
Seeds cannot have a negative EROEI during storage because they have no energy input during storage and are simply consuming stored chemical energy at an incredibly slow rate.
In natural systems there are no energy profits: there is simply conversion of energy which is ultimately derived from the Sun into other forms of energy, or using energy derived from the Sun to drive chemical processes (other than organisms that derive energy from geothermal/geochemical systems).
Contrary to what you cay, there has been an abundance of energy on Earth for billions of years. The obstacle organisms had to overcome was capturing some of that abundant energy, either as ‘producers’ (plants) consumers (animals) or decomposers (bacteria, fungi etc.) For hundreds of ,millions of years there has been near-perfect energy balance, and when some major disturbance to the system occurred (like an asteroid impacting) the system responded tor restore energy balance.
Note that mammals are incredibly inefficient users of energy. However, their high body temperature has allowed them to dominate ecosystems because the high body temperature (maintained by constantly breaking down carbohydrates, proteins and lipids) has provided speed, agility, sustained high-level energy use, adaptations to otherwise inhospitable conditions etc. that have given them reproductive advantages and ‘fitness’ advantages over organisms that do not operate at a high temperature.
Birds, operating at similarly high temperatures, have similarly established themselves near the top or at the top of food chains. Penguins living on or near Antarctica must be one of the finest examples, demonstrating the advantage to be gained from operating a high-temperature metabolism: any ‘cold-blooded’ organism would freeze solid within minutes in the winter.
The problem for mammals and birds is to maintain the high rate of energy conversion by acquiring sufficient stored energy on a more or less continuous basis (a shrew is said to eat its own mass in ‘high-energy’ food every day; a cow spends most of its days eating ‘low-value’ food, so low it requires the assistance of bacteria to release the usable substances).
Humans got into the present pickle by learning to use fossil fuels to maintain their body temperatures, to expend less energy acquiring food, and expend less energy moving from place to place. And now, having generated excessive amounts of ‘free time’, to keep themselves amused.
Just for the record, today I purchased $40 worth of concentrated chemical energy (petrol) for one of my energy slaves and used some of that energy to transport stores of chemical energy (food) to my home. Depending on factors I cannot be certain about, I expect the remaining petrol to last me 2 or 3 months.
LikeLike
Kevin, you’re correct about the seeds. My mistake. They are just bundles of life living on stored energy (profit produced by the mother plant) until such time that conditions are right to start doing their own gain of energy. That last expenditure of energy, getting up through the soil to reach light, is the hardest part and many seeds fail that struggle; a huge energy investment required with no return until emerging.
I didn’t think it through adequately but the point of the post was that it’s difficult for animals to get a positive EROEI and we have forgotten. How do we get sun energy into our stomachs? There are a number of ways to accomplish this, some not being very “nice”. The time is coming when we will remember. I don’t expect to see more “jobs” and “higher min. wage” as an answer to the predicament.
LikeLike
I think cows deserve more respect than we give them. They never fart and seldom burp. The fact that they can convert grass into essential amino acids makes them extremely valuable for predators like us. They have been the object of worship for this reason along with our fondness of their gentle and kind natures. When the tractors stop running, the grass will still grow for a while, radiation or not. Grass-legume is the best thing for land I can think of. Cows will still be around converting sunshine into protein, fats and carbs. Most people don’t know that cows are meat eaters. They “eat” the equivalent of 35 lbs. of steak each day, produced by their microbes which die at that rate. They don’t themselves eat the grass or grain. Just the facts.
What man has done with cows is another story.
LikeLike
I think of industrialised dairy farming as animal abuse. Sadly, the things humans do to pigs and chickens in industrialised protein production are worse.
An indication of how crazy it has all become is that some NZ dairy farmers feed imported palm kernel to their stock. Why? Because they can.
LikeLike
Those equations look suspiciously like Algebra.
I’ll take your word for it.
LikeLike
Com’on lazy brains, you shouldn’t take my word for it. Algebra is not some kind of nightmarish calvary. In this case it’s easy and quite exciting to show your friends. It’s a lot more self-convincing than quoting some peak-oil wizard, to be able to say: “Peak-oil is real, because I checked and calculated it myself.”
It’s like the difference between a Mc Donald’s junk-food meal and a home cooked diner for two.
LikeLike
Hans, our local farmers market is always on the brink of failure: never enough critical mass of vendors or customers. The problem with fresh food was described to me: “you have to cook it.”
LikeLike
Take heart and patience Lidia. The time will come that local farmers markets will be the main food source for most people.
LikeLike
Every King wants his monument:
http://www.foxnews.com/politics/2014/04/26/illinois-dems-back-off-100-million-obama-library-following-outrage/
LikeLike
The Ozymandias Public Library.
LikeLike
Shelley’s Ozymandias
I met a traveller from an antique land
Who said: Two vast and trunkless legs of stone
Stand in the desert. Near them, on the sand,
Half sunk, a shattered visage lies, whose frown,
And wrinkled lip, and sneer of cold command,
Tell that its sculptor well those passions read
Which yet survive, stamped on these lifeless things,
The hand that mocked them and the heart that fed:
And on the pedestal these words appear:
“My name is Ozymandias, king of kings:
Look on my works, ye Mighty, and despair!”
Nothing beside remains. Round the decay
Of that colossal wreck, boundless and bare
The lone and level sands stretch far away..
LikeLike
The Gross Society: We’re Entering an Age of Energy Impoverishment
WHILE AMERICA’S CURRENT GROSS oil production numbers appear rosy, from an energy accounting perspective the figures are frightening: Energy profit margins are declining fast.
Each year, a greater percentage of U.S. oil production comes from unconventional sources—primarily tight oil and deepwater oil. Compared to conventional oil from most onshore, vertical wells, these sources demand much higher capital investment per barrel produced. Tight oil wells typically require directional drilling and fracking, which take lots of money and energy (not to mention water); Initial production rates per well are modest, and production from each tends to decline quickly. Therefore, more wells have to be drilled just to maintain a constant rate of flow. This has been called the “Red Queen” syndrome, after a passage in Lewis Carroll’s Through the Looking Glass.
In Carroll’s story, the fictional Red Queen runs at top speed but never gets anywhere. “It takes all the running you can do, to keep in the same place,” she explains to Alice. Similarly, it will soon take all the drilling the industry can do just to keep production in the fracking fields steady. But the plateau won’t last; As the best drilling areas become saturated with wells and companies are forced toward the periphery of fuel-bearing geological formations, costs will rise and production will fall. When, exactly, will the decline begin? Probably before the end of this decade…
…Lower energy profits from unconventional oil inevitably show up in the financials of oil companies. Between 1998 and 2005, the industry invested $1.5 trillion in exploration and production, and this investment yielded 8.6 million barrels per day in additional world oil production. But between 2005 and 2013, the industry spent $4 trillion on exploration and production, yet this more-than-doubled investment produced only 4 mb/d in added production.
It gets worse: All net new production during the 2005-13 period came from unconventional sources; of the $4 trillion spent, it took $350 billion to achieve a bump in production. Subtracting unconventionals from the total, world oil production actually fell by about a million barrels a day during these years. That means the oil industry spent over $3.5 trillion to achieve a decline in overall conventional production.
Last year was one of the worst ever for new discoveries, and companies are cutting exploration budgets. “It is becoming increasingly difficult to find new oil and gas, and in particular new oil,” Tim Dodson, the exploration chief of Statoil, the world’s top conventional explorer, recently told Reuters. “The discoveries tend to be somewhat smaller, more complex, more remote, so it is very difficult to see a reversal of that trend…. The industry at large will probably struggle going forward with reserve replacement.”
The costs of oil exploration and production are currently rising at about 10.9 percent per year, according to Steve Kopits of the energy analytics firm Douglas-Westwood. This is squeezing the industry’s profit margins, since it’s getting ever harder to pass these costs on to consumers.
In 2010, The Economist magazine discussed rising costs of energy production, musing that “the direction of change seems clear. If the world were a giant company, its return on capital would be falling.”
Tim Morgan, formerly of the London-based brokerage Tullett Prebon (whose customers consist primarily of investment banks), explored the average Energy Return on Energy Investment (EROEI) of global energy sources in one of his company’s Strategy Insights reports, noting: “For 2020, our projected EROEI (of 11.5:1) [would] mean that the share of GDP absorbed by energy costs would have escalated to about 9.6 percent from around 6.7 percent today. Our projections further suggest that energy costs could absorb almost 15 percent of GDP (at an EROEI of 7.7:1) by 2030…. [T]he critical relationship between energy production and the energy cost of extraction is now deteriorating so rapidly that the economy as we have known it for more than two centuries is beginning to unravel.”
From an energy accounting perspective, the situation is in one respect actually worst in North America—which is deeply ironic: It’s here that production has grown most in the past five years, and it’s here that the industry is most boastful of its achievements. Yet the average energy profit ratio for U.S. oil production has fallen from 100:1 to 10:1, and the downward trend is accelerating as more and more oil comes from unconventional sources.
These profit ratios might be spectacular in the financial world, but in energy terms this is alarming. Everything we do in industrial societies—education, health care, research, manufacturing, transportation—requires energy. Unless our investment of energy in producing more energy yields an average profit ratio of roughly 10:1 or more, it may not be possible to maintain an industrial (as opposed to an agrarian) mode of societal organization over the long run.
NONE OF THE UNCONVENTIONAL sources that the petroleum industry is turning toward (tight oil, tar sands, deepwater) would have been developed absent the context of high oil prices, which deliver more revenue to oil companies; it’s those revenues that fund ever-bigger investments in technology. But older industrial economies like the U.S. and European Union tend to stall out if oil costs too much, and that reduces energy demand; This “demand destruction” safety valve has (so far) set a limit on global petroleum prices. Yet for the major oil companies, prices are currently not high enough to pay for the development of new projects in the Arctic or in ultra-deepwater; this is another reason the majors are cutting back on exploration investments.
For everyone else, though, oil prices are plenty high. Soaring fuel prices wallop airlines, the tourism industry, and farmers. Even real estate prices can be impacted: As gasoline gets more expensive, the lure of distant suburbs for prospective homebuyers wanes. It’s more than mere coincidence that the U.S. housing bubble burst in 2008 just as oil prices hit their all-time high.
Rising gasoline prices (since 2005) have led to a reduction in the average number of miles traveled by U.S. vehicles annually, a trend toward less driving by young people, and efforts on the part of the auto industry to produce more fuel-efficient vehicles. Altogether, American oil consumption is today roughly 20 percent below what it would have been if growth trends in the previous decades had continued….
…IF OUR ECONOMY RUNS on energy, and our energy prospects are gloomy, how is it that the economy is recovering?
The simplest answer is that it’s not—except as measured by a few misleading gross statistics. Every month the Bureau of Labor Statistics releases figures for new jobs created, and the numbers look relatively good at first glance (113,000 net new jobs for January 2014). But most of these new jobs pay less than those that were lost in recent years. And unemployment statistics don’t include people who’ve given up looking for work. Labor force participation rates are at their lowest level in 35 years.
All told, according to a recent Gallup poll, more Americans say they are worse off today than they were a year ago (as opposed to those who say their situation has improved).
Claims of economic recovery fixate primarily on one number: Gross Domestic Product, or GDP. That number is going up—albeit at an anemic pace in comparison with rates common in the 20thcentury; hence, the economy is said to be growing. But what does this really mean? When GDP rises, that indicates more money is flowing through the economy. Typically, a higher GDP equates to greater consumption of goods and services, and therefore more jobs. What’s not to like about that?
First, there are ways of making GDP grow that don’t actually improve lives. Economist Herman Daly calls this “uneconomic growth.” For example, if we spend money on rebuilding after a natural disaster, or on prisons or armaments or cancer treatment, GDP rises. But who wants more natural disasters, crime, wars, or cancer? Historically, the burning of ever more fossil fuels was closely tied to GDP expansion, but now we face the prospect of devastating climate change if we continue increasing our burn rate. To the extent GDP growth is based on fossilfuel consumption, when GDP goes up we’re actually worse off because of it. Altogether, Gross Domestic Product does a really bad job of capturing how our economy is doing on a net basis.
Second, a growing money supply (which is implied by GDP growth) depends upon the expansion of credit. Another way to say this is: A rising GDP (in any country with a floating exchange rate) entails increasing levels of outstanding debt. Historical statistics bear this out. But is any society able to expand its debt endlessly?
If there were indeed limits to a country’s ability to perpetually grow GDP by increasing its total debt (government plus private), a warning sign would likely come in the form of a trend toward diminishing GDP returns on each new unit of credit created. That’s exactly what we’ve been seeing in the U.S. in recent years. Back in the 1960s, each dollar of increase in total U.S. debt was reflected in nearly a dollar of rise in GDP. By 2000, each new dollar of debt corresponded with GDP growth of only $0.20. The trend line will reach zero in about 2016.
Meanwhile, it seems that Americans have taken on about as much household debt as they can manage, as rates of consumer borrowing have been stuck in neutral since the start of the Great Recession. To keep debt growing (and the economy expanding, if only statistically), the Federal Reserve has artificially kept interest rates low by creating up to $85 billion per month through a mere adjustment of its ledgers (yes, it can do that); it uses the money to buy Treasury bills (U.S. government debt) from Wall Street banks. When interest rates are low, people find it easier to buy houses and cars (hence the recent rise in house prices and the auto industry’s rebound); it also makes it cheaper for the government to borrow—and, in case you haven’t noticed, the federal government has borrowed a lot lately.
The Fed’s Quantitative Easing (QE) program props up the banks, the auto companies, the housing market, and the Treasury. But, with overall consumer spending still anemic, the trillions of dollars the Fed has created have generally not been loaned out to households and small businesses; they’ve simply pooled up in the big banks.Fed policy has thus generated a stock market bubble, as well as a bubble of investments in emerging markets, and these can only continue to inflate for as long as QE persists.
The obvious way to keep these bubbles from growing and eventually bursting (with attendant financial toxicity spilling over into the rest of the economy) is to stop QE. But doing that will undermine the “recovery,” such as it is, and might even send the economy careening into depression. The Fed’s solution to this “damned if you do, damned if you don’t” quandary is to taper QE, reducing it gradually over time. This doesn’t really solve anything; it’s just a way to delay and pretend.
With money as with energy, we are doing extremely well at keeping up appearances by characterizing our situation with a few cherry-picked numbers. But behind the jolly statistics lurks a menacing reality. Collectively, we’re like a dietician who has adopted the attitude of the more you weigh, the healthier you are! How gross would that be?…
LikeLike
‘The [GDP/debt] trend line will reach zero in about 2016.’
Actually it’s 2015.
Never mind. Everything I have seen in recent years indicates a huge collision between excreta and the rotating device around 2016.
Just think: we’ve got around 18 months. Unless ‘hairstyle looking for a brain’ manages to start WWIII later this year.
LikeLike
I have been following American expat financial analyst Jim Willie for years. http://news.goldseek.com/GoldenJackass/ His thesis is that QE is actually destroying and wiping out real Western capital in huge swaths. Having lived in both the US and more recently in East Asia, I have to agree with this idea. Since I witnessed both great prosperity in the US during the 60s, 70s and early 80s when there was (in the best Marxian/Adam Smithian sense) a real value-adding industrial & manufacturing base, and in the hyper-financialized 90s-20teens world of fictitious capital (see Loren Goldner: http://home.earthlink.net/~lrgoldner/ and Marx) where prosperity is nothing but vaporous illusions; and in the last years living in China and East Asia, where there is a radically new industrial/value-adding capital creation engine that is manufacturing at least superficial (albeit planet-annihilating) material prosperity at an undeniable rate. QE is also at work in countries like China, Korea and Thailand, but these areas have functioning capitalist economies, while the US and much of the de-industrialized West are now self-immolating sacrifice zones.
LikeLike
LikeLike
That’s really sad news!
Thank you Michael Ruppert.
You were one of whom opened my eyes to the realities of today’s world.
LikeLike
RIP Mike Ruppert. Your last poem showed your love for Mother Earth and all her creatures, you are one with the Great Spirit.
LikeLike
I don’t need no stinkin’ math. We hit Peak Oil when I can’t afford a gal.of gas.rofl
LikeLike
Thank you very much TR, very kind of you.
By the way, this widespread kind of opinion on math is another reason why the U.S. is fading away as a world leader: with lazy-brains left right and center, a society just sinks down into ignorance.
LikeLike
Hans Zandvliet,
You may want to research rolf to find what it may mean when found at the end of a commit.
LikeLike
“gal.of gas.rofl”, “rofl”, “commit”: is this English language, or unintelligible word salad?
I expect clear and straight forward language, or it’s not worth corresponding.
LikeLike
Rofl = rolling on floor, laughing. TR was being sarcastic, mimicking the reaction of “Everyman”.
LikeLike
Featuring an interview with author and civil rights activist Eugene Puryear, discussing when the ‘War on Poverty’ became a war against the poor:
LikeLike
http://www.globalresearch.ca/forty-years-later-from-dictatorship-to-neoliberalism-portugal-as-a-model-for-a-new-socialism/5379159
“At a time when the dream of socialism seemed to be over – with the decline of the eastern bloc and the fall of the Berlin Wall, with its activists reintegrating into the capitalist system – it turns out that socialism is a dream of humanity and a dream of humanity cannot be suppressed. It will come out time and again anew until it is realized. However, this might happen differently than its early proponents predicted.
Capitalism is not the final state of civilization. A system directed toward exploitation and profit cannot last in the long run. Its inherent violence destroys everything which is alive and valuable; it destroys resources and the basic necessities of life. Young people are rising up against this in all parts of the planet. It is only a matter of time before the collapse of the system; a short time.
Strange as it may seem, in the countries most affected by the crisis, a possible alternative is arising: a humane socialism of interconnected autonomous regions and communities, of self-determination and cooperation with nature. A socialism of trust in which people can experience community before they engage in thesocialization of production. A socialism of self-organization that subverts systems of globalized capitalism because it no longer cooperates with them and no longer offers a target for their counter powers. Once the first functioning examples are visible it spreads among the youth of the world like wildfire.
This movement will, like any other, unfold to its revolutionary potential as far as its advocates and activists become conscious of the dream that connects them all.”
LikeLike
http://news.yahoo.com/more-renounce-us-citizenship-deny-stereotype-162509477.html
More renounce US citizenship but deny stereotype
[It’s not all about tax evasion by the rich]
LikeLike
We are going back to being subjects. Some of us were fortunate to live in a place and period of history that allowed us more freedom and choice than 99% of everyone who ever lived since civilization began.
LikeLike
Site & trailer for “6”…due this fall. From Louie Psihoyos who made The Cove.
http://6themovie.opsociety.org/
LikeLike
If you haven’t seen The Cove and have the stomach for it…and don’t mind Chech subtitles…here it is
http://vimeo.com/63998647
LikeLike
LikeLike
The price of most Chinese-made consumer goods bottomed out between 2005 and 2010, when one could buy an electric drill around here for under $20.
The fall in consumer prices associated with the opening up of China allowed politicians to get away with their numerous lies about the benefits of globalisation.
Here in NZ the ‘rising’ dollar has masked much of the effect of higher oil prices and higher production costs in China. I imagine the effect of higher oil prices and higher consumer goods prices in nations that have seen currencies clobbered over the past decade or so must be devastating. And with higher food prices, and worse forecast,, the crunch point for revolt or suicide must be approaching fast in a lot of locations..
I’m sure TPTB are well aware of this and have been preparing their ‘security’ arrangements, whether it be supplying armoured personnel carriers and water cannons to police forces or criminalising protest.
LikeLike
Reblogged this on Deep Green Resistance New York.
LikeLike
Thought you all might enjoy the lyrics to this song.
LikeLike
LikeLike
A serious misapprehension further down that item.
‘If Europe doesn’t want the growth which comes from using Russian gas and oil, well, China and others will be happy to take it.’
Growth? Most of Europe would implode without Russian gas.
‘Europe’s biggest economy depends on Russia for 35 percent of its gas.’
http://www.zerohedge.com/news/2014-03-30/german-executives-denounce-euus-leaders-over-russia-confrontation
LikeLike
LikeLike
The capital-induced climate destabilization on hand necessitates a worldwide revolution.
The psychical alienation and mutilation imposed by capitalism largely explains the fact that those from below “tolerate […] the constant wars, oppression, greed, cut[t]hroat competition, suffering, and destruction of the environment and this planet that the people in power inflict on the majority around the globe.
On the individual and group levels, too, the “only reasonable response” to the depth of the environmental crisis “would be for everyone who is aware of the situation to forget about their personal lives [sic] and immediately start a crusade to stop capitalism’s assault on nature and the entire planet”.
Organizations which claim the revolutionary mantle must “place the struggle against climate change […] as the highest priority in [their] program and [their] daily practice,”
And that they should toward this end “immediately initiate a massive campaign about the need to overthrow capitalism as our only chance to avert the extinction of the human race, and combine [this] with daily interventions against the effects of ongoing environmental destruction”.
The grip which conformity, adjustment, bourgeois distraction, anxiety, and anomie hold over most people in “advanced” capitalist societal settings represents an intriguing explanation for the marked lack of mass-revolutionary consciousness and praxis vis-à-vis this seemingly quite terminal of threats to human happiness and flourishing and ecological balance.
Climate Change and Human Alienation: http://dissidentvoice.org/2014/04/climate-change-and-human-alienation-2/
LikeLike
Alienation- a key word with many parents. Artists, some of them anyway, are infamously cited-as outsiders, crazy, etc.. Celebrators of life (we even have ‘life classes’), we artists are maybe trying to get back to Eden, that is, a more natural and nurturing mode of being and doing. For decades I’ve tried to frame a call to the creation of a better vision, an alternative to mindless consuming and exhuming (to be polite)-but what I do as artist, what I am as a worker and what the things and images I make are not taken as intended. Words about non-word things don’t parse, never mind persuade. The best I can approximate is perhaps to suggest the life of the craftsman along with the life of the image-maker or the shaman. Ample room for those who use traditional (hand-articulated means) and any more complex technologies to realize a moment to share-in a song, a drawing, a poem or dance. Are these products to ‘consume’? Or connecting threads that only function when completed by being taken in or up by a listener, a dance partner, a viewer or reader? As artists, writers of the sage, we can either illustrate, as XRay Mike does so well, or simply offer our work and works into our shared, ongoing being. And it is often of low cost…
LikeLike
A very worthwhile interview here, in which American exceptionalism and war-mongering are discussed.
http://robinwestenra.blogspot.co.nz/2014/04/frasers-warning-to-new-zealand.html
LikeLike
http://blogs.citypaper.com/index.php/the-news-hole/desperate-hustle-way-life/
The desperate hustle as a way of life
Here is the future: nobody gets any job security. Nobody gets a fair wage while they have a job. Nobody gets a retirement fund or even any guarantee they’ll be able to eat tomorrow. And almost everyone is doing everything they can just to get by—and paying some substantial portion of their earnings to a pimp or “platform” which controls the business they are in. And ain’t life a grand adventure? Isn’t it all so fun?
Welcome to the Sharing Economy.
This is the model of the new economy, where anyone with a car ought to be a Lyft contractor (your fare pays what he or she thinks is right but the company is tweeting out “we’ve slashed prices 20 percent”) and anyone with a house or apartment is renting it out on Air BnB and crashing at their boyfriend’s parents’ place.
All of this came about by design. The world is arranged according to the people who arrange things—the people who make money by this arrangement. We’re in our fourth decade of this. The Times reported this week that the American middle class has been surpassed by Canada’s.
And it’s much worse than the New York Times imagines. As Dean Baker points out, the middle classes in most other countries have increased their incomes while getting longer vacations. In the U.S.A.? Not so much.
This WaPost piece on how hard it is to “regulate” Air BnB limns the issue and never confronts it. But this life of hustle—the idea that everything you do, every day, needs to turn a profit or you starve—is familiar to anyone who lives or grew up in an inner city. In Salon today, D. Watkins points to the junkies putting on a fight-show for crack, and the lady who runs the candy/cig shop out of her second floor window, lowering the product down in a pencil box tied to a rope of shoelaces. You’ve seen the guys moving “loosies” and the guys selling the bags from the food pantry.
They are fucked. And we are them.
The kid who runs Lyft—John Zimmer—is a nice boy from Fairfield County. I grew up in Fairfield, and I remember in junior high wondering about a sign on a classroom wall which described an item in the curriculum. It said something to the effect of, “all students will learn the basics of how to manage staff.”
And I thought, in my 13-year-old brain, “But that’s ridiculous! How many of us are destined to have a staff to manage?”
But I was naïve. I did not yet understand that, in my town, 90 percent of my peers’ parents were managers, and all expected their kids to be bigger managers. I did not realize then that the whole nation’s economic credo would soon be re-imagined around the mathematically impossible idea that everyone—everyone!—is not just a manager, but an entrepreneur.
I did not yet understand then that those having or wanting just a job—just a job with decent pay—would be disparaged as “takers.”
I did not realize that, in 30 years, skilled people would be working basically for free just on the off chance they’d strike it rich in Silicon Valley.
And that, within my lifetime, those who did win that lottery would do so mainly by “innovating” a way to make all their staffers work for no pay at all—and kick their earnings up the line to those very smart managers.
It reminds me of one of my uncles, who spent the ‘80s scheming his way to a minor fortune in slum properties (all since lost, of course). One detour he took was Amway, and we ended up with some products in the house and I went to at least one “Amway Meeting” wherein I was pitched on the magic of “your downline.”
All this “innovation” notwithstanding, nothing happening in tech today looks very different. We’re all downline now.
The Lyft kid calls it “sharing.”
Today there are people all over Baltimore subleasing places they don’t own, peddling without a license, hacking. This is a criminal offense. The law does not recognize the right of the people to earn enough to eat.
All these entrepreneurs, most of them running little scams to get by, all of them held in contempt by the law and by most of society. Lyft and Uber and Air BnB face legal sanction too—but it’s just a civil matter. They break the same kinds of laws, but grandly. We respect their entrepreneurship because it is backed by venture capitalists.
So as Air BnB, Lyft, Sidecar and the rest formalize the shadow economy, turning jobs into hobbies and salaries into piecework and commission, think for just a minute about what this means for the prospect of honest work. Consider what the country, the world, and the economy will look like after another couple decades of this. Wonder, for just a second, if we’re sharing the wrong things with the wrong people.
LikeLike
So much angst, worry & frustration. I keep suggesting that you guys should relax and enjoy yourselves, but no, back again once more with the constant complaining. Oh well, some day, probably in the not too distant future, you might get a chance to reflect that these are indeed the good old days.
As we all know, it only gets worse from here – day after day of steady declines, perhaps accelerating at certain points as various economic/environmental factors create periodic stair-step functions.
Since I’ve ordained my public role to help people understand how things play out, I’ll go ahead and throw out a few trends for your consideration:
– petty crime
– inebriation
We’re not yet at the point where crime manifests itself in wholesale social disorder; rather, we’re still at the petty stage where anything of nominal value not locked down or closely watched will be pilfered, usually with associated property damage. Alas, gone are the days of professional thieves and the elegant heist.
Public intoxication really seems to be increasing rather dramatically. Note that I’ve spent my entire life along the Calif coast in various beach communities, so I think I have a pretty good idea on what drug use and inebriation look like. I think the legalization of MJ in CO & WA are merely precursors, that ‘leaders’ certainly are looking at ways of relaxing the drug war(s) and encouraging people to just check out.
Both of these trends are obvious if one gets out and socializes. It’s why I highly recommend getting with the program and attempting to blend in with the crowd. Being a zebra amongst thousands of others allows you to quickly get relevant scuttlebutt about certain predators.
Of course, the real big play is non-linear – the sheep will never see it coming. But for your collective edification, I’ll simply mention that the Russian gambit is the US/NATOs “all in” moment. We either successfully achieve regime change, or we’re shit out of luck. I, for one, think it’s all over except for the crying, which is why I’m looking at the resulting fall out response(s) the state will make in an attempt to maintain domestic control.
That means not only will traditional methods of public dissent be curtailed, but we can all say bye-bye to this fascinating period where we could exchange ideas & thoughts with others who knew what was going on. Other than that, make sure you’re in great shape, because the rationing is gonna be a real bitch.
LikeLike
I think I know what might be ailing you…
In Old Age, Lack of Emotion and Interest May Signal Your Brain Is Shrinking
LikeLike
That’s right B9K9. Once again no one “gets it” except you. You are just so fucking superior to the rest of us doomers.
LikeLike
Not easy to improve on what you said, though I don’t classify myself as a doomer, and prefer to think of myself as a liberator. After all, what is more liberating that taking off blindfolds and chains?
LikeLike
Yes, the label ‘Doomer’ implies that we desire death and destruction and revel in it, whereas in reality we are actually wanting to prevent those very things by shedding light on industrial civ’s omnicidal trajectory.
LikeLike
Beekeepers search for answers as colonies show up damaged after almond farm pollination
Published: Saturday, Apr. 19, 2014 – 9:09 pm
Last Modified: Sunday, Apr. 20, 2014 – 9:07 am
As many as 80,000 bee colonies have died or been damaged this year after pollinating almond trees in the San Joaquin Valley, and some beekeepers are pointing to pesticides used on almond orchards as a possible cause.
The damaged colonies are the latest worry in the beekeeping community, which is already struggling to deal with colony collapse disorder, a phenomenon in which beekeepers open hives after pollination and find them empty, with the bees nowhere to be found.
The damaged hives are a significant agricultural issue. Ninety percent of honeybees that pollinate crops in the United States are used during the California almond bloom. And there is a cascading effect. Bees used to pollinate almond trees typically are moved to pollinate other crops, such as apples, cranberries, cherries and watermelons.
It’s not clear why the damaged hives are showing up this year, as opposed to prior years.
“We’re a little mystified,” said John Miller, a beekeeper based in Newcastle. “We have some colonies that looked like they’ve been through some kind of brood die-off. It’s puzzling because it is intermittent and random.”
Read more here: http://www.sacbee.com/2014/04/19/6338235/beekeepers-search-for-answers.html#storylink=cpy
LikeLike
Capitalism controls the state, and the state controls capitalism. Where does one begin and where does the other end? For the police are the physical extension of intra-national economic warfare, and the army is the physical extension of international economic warfare. Here is an Adam Smith quote that explains the romance between the state and capitalism, “Civil government, so far as it is instituted for the security of property, is in reality instituted for the defense of the rich against the poor, or of those who have some property against those who have none at all.” Within a system of economic hierarchy and class warfare, there are going to be inevitable rebellions from those who have no property towards those who do have property. The state is what helps protect the inherent instability within a system of perpetual economic warfare. So according to the great philosophical priest of capitalism Adam Smith, capitalism is so inefficient and unsustainable that it requires a monopoly on the use of legal violence in order to maintain it.
Philip Richlin, The Socioeconomic Guardians of Scarcity
LikeLike
One important guardian of scarcity is the belief system that socioeconomic hierarchy is a part of human nature. Markets, states and other forms of socioeconomic hierarchy are not inevitable institutions that arise when there are multiple people. Quoting Dr. James Gilligan, “Violence is not universal. It is not symmetrically distributed throughout the human race. There is a huge variation in the amount of violence in different societies. There are some societies that have virtually no violence. There are others that destroy themselves.” Competition and Behavioral Violence are reactions to environmental conditions, and mechanisms for survival under certain environmental conditions (for example under capitalism people are forced to compete with each other for jobs in order to survive). However different contexts bring about varied mechanisms for survival including behaviors such as consent, cooperation and pan empathy. Quoting Robert Sapolsky, “It is virtually impossible to understand how biology works outside the context of environment.” Our true human nature is to adapt to our nurture. We are not genetically determined towards socioeconomic hierarchy. Quoting Gabor Mate, “The genetic argument is simply a cop-out which allows us to ignore the social and economic and political factors that, in fact, underlie many troublesome behaviors.” This leaves us with the question: what contexts incentivize mutual aid and compassion, and which contexts incentivize parasitic competitive behavior? Mutual Aid and competition can be seen as survival strategies that can be reinforced and even eliminated depending on the environment. And to what extent are we able to share and give when we are under perpetual threats of absolute or relative deprivation of resources? To what extent can we build a library society when the market surrounding the library society creates the incentive to steal from the commons and then sell the stolen resources?
Philip Richlin, The Socioeconomic Guardians of Scarcity
LikeLike
From the May 2014 issue of National Geographic:
LikeLike
LikeLike
I’m linking here a summary of the BGR’s latest estimates of global fossil fuel resources and reserves.
http://j.mp/FF_RR_2013
LikeLike
Question: How does the CDIAC separate out the CO2 emissions from the various fossil fuel sources as well as natural background emissions from fires, volcanoes, etc? Is there a link at their site that explains this?
Answer from Hans:
Hi Mike,
CDIAC uses cement production data from the USGS (US Geological Survey) and the UN energy statistics. CDIAC focuses on CO2 from fossil fuels, so it excludes CO2 emissions from other sources, like volcanoes, forest fires, land degradation, etc. It also excludes other greenhouse gases, like methane, CFCs, nitrous oxides, aerosols, etc.
Under the UNFCCC (United Nations Framework Convention on Climate Change) agreements, all countries have an obligation to supply national data related to climate change. In this way the UNFCCC receives historical import, export and refinery data that mention the type of fossil fuel, so it’s not that difficult to split them up into solid, liquid and gaseous.
The latest report on climate change of Working Group 1 (WG-I), of the 5th Assessment Report (AR5) of the IPCC (September 2013) shows the following graph on page 487:
In the explanation you see CDIAC appear as a data source. It also says that CDIAC gets its data from the USGS and the UN energy statistics (which is a discovery for me as well).
Here’s a link to the UN energy statistics: (http://unstats.un.org/UNSD/energy/yearbook/default.htm).
Best,
Hans
LikeLike
William Rees // Part 1 of 3 // Why Degrowth?
Part of the 2014 Extraenvironmentalist / Vancouver Degrowth Live Event Series
William Rees is a human ecologist, ecological economist, Professor Emeritus and former Director of the University of British Columbia’s School of Community and Regional Planning.
LikeLike
Hello there! Do you know if they make any plugins to safeguard against
hackers? I’m kinda paranoid about losing everything I’ve worked hard on. Any recommendations?
LikeLike
Hi! This is my first visit to your blog! We are a group of
volunteers and starting a new project in a community in the same niche.
Your blog provided us valuable information to work on. You
have done a outstanding job!
LikeLike